Figure 4.
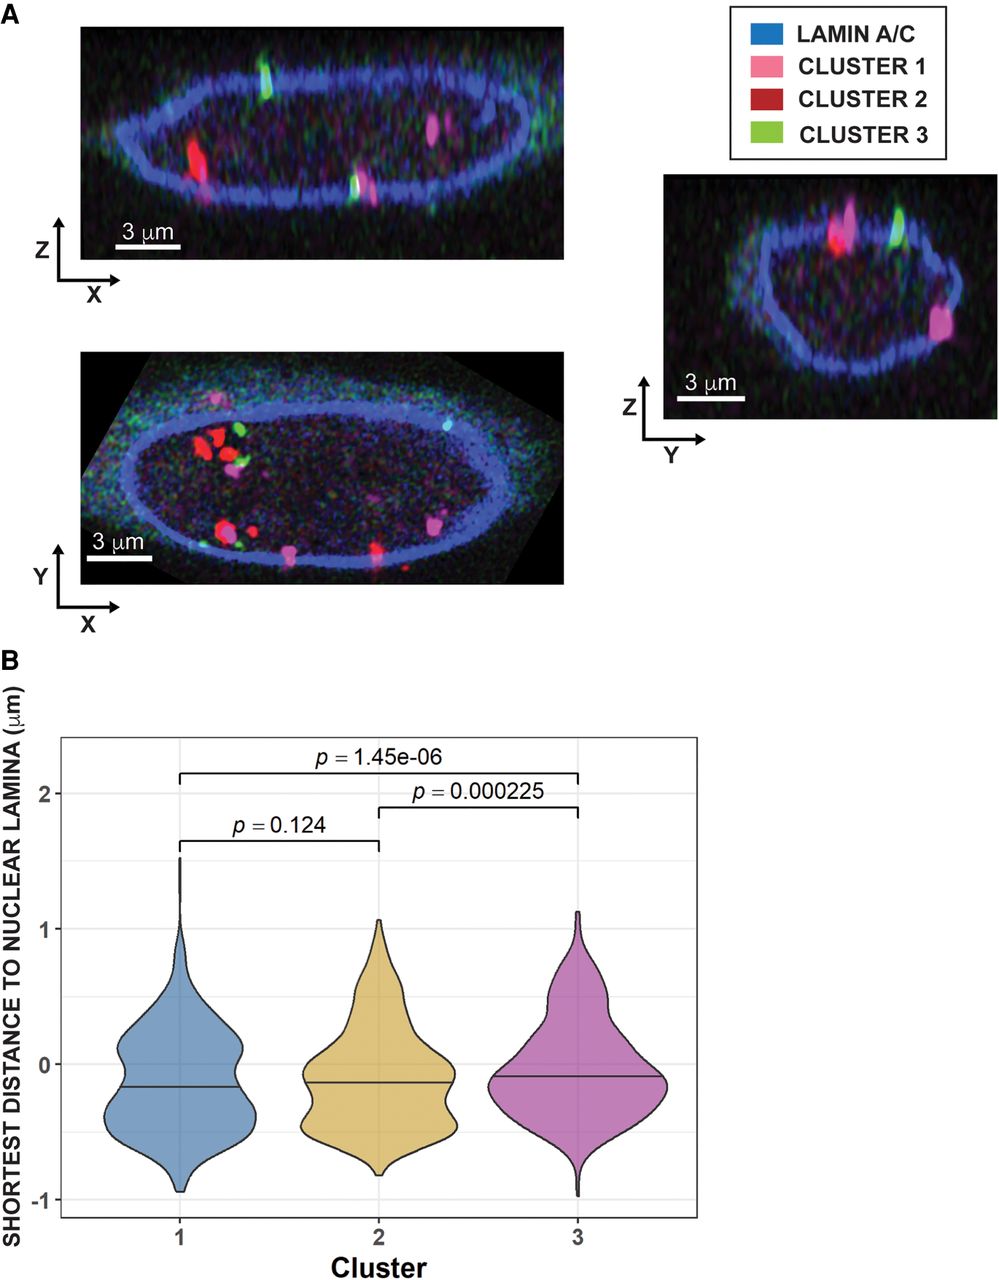
Analysis of cluster localization by DNA FISH. (A) Two-dimensional slices showing cluster localization in a representative cell. Individual images capture a subset of the labeled loci present in each cell. (B) Violin plot showing distance of representative cluster LADs from the nuclear lamina, as determined by lamin A/C staining (blue). FISH probes were made to target three LADs each from Clusters 1 (pink) and 3 (green) and four LADs from Cluster 2 (red). A total of 58 cells were sampled (see Methods for details).