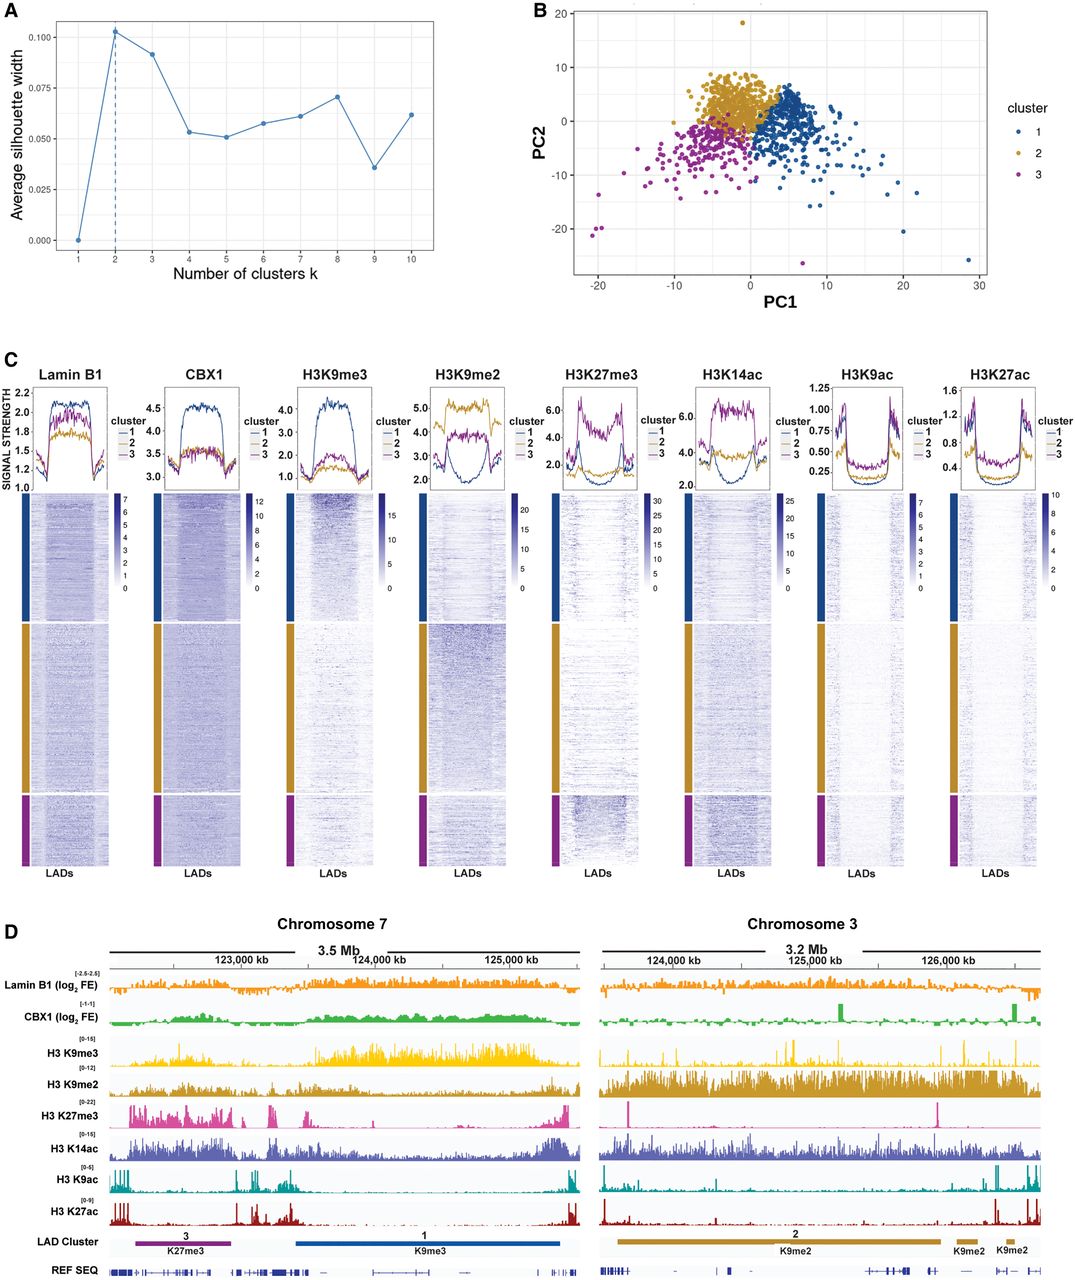
Clustering LADs by chromatin profile. (A) Silhouette plot of k-means clustering of LADs. (B) Principle component plot of LAD clusters. The gold dot at the top of the plot consists of ∼two dozen LADs and is the reason the elbow plot suggests four clusters rather than three. (C) Heat maps and profiles of feature abundance across LADs, separated into Cluster 1 (blue), Cluster 2 (gold), and Cluster 3 (purple). Profiles represent the average signal strength (y-axis) from one end of the LAD to the other (x-axis) and extend 300 kb beyond each LAD border. Heat map color intensity denotes signal strength for that feature. (D) IGV browser view illustrating examples from each LAD cluster (from left to right): Cluster 3 (K27me3 LADs) in purple, Cluster 1 (K9me3 LADs) in blue, Cluster 2 (K9me2 LADs) in gold.