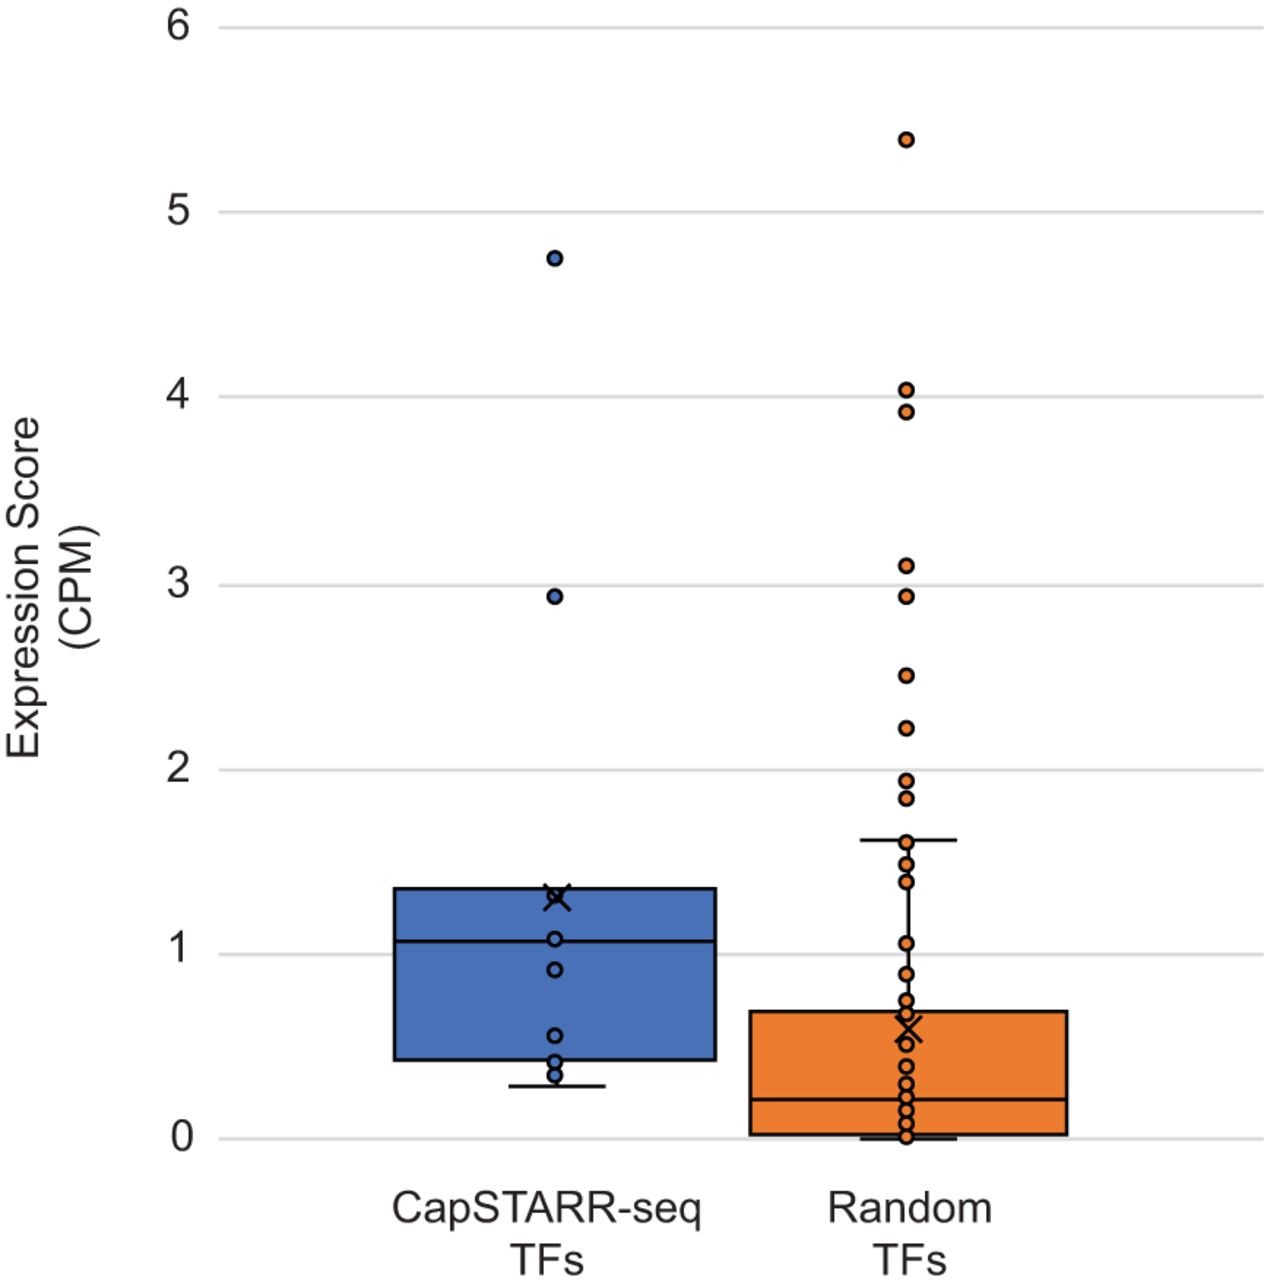
Figure 2.
Expression of transcription factors (TFs) with enriched binding site motifs. Single-cell RNA sequencing expression score is displayed on the y-axis and measured in counts per million (CPM). A higher expression score indicates a more highly expressed gene. For each plot, the solid line represents the median expression score whereas the “X” represents the mean expression score. Individual TF expression scores are shown as data points on the box plots. Expression scores were compared using a two-sample, two-tailed t-test.