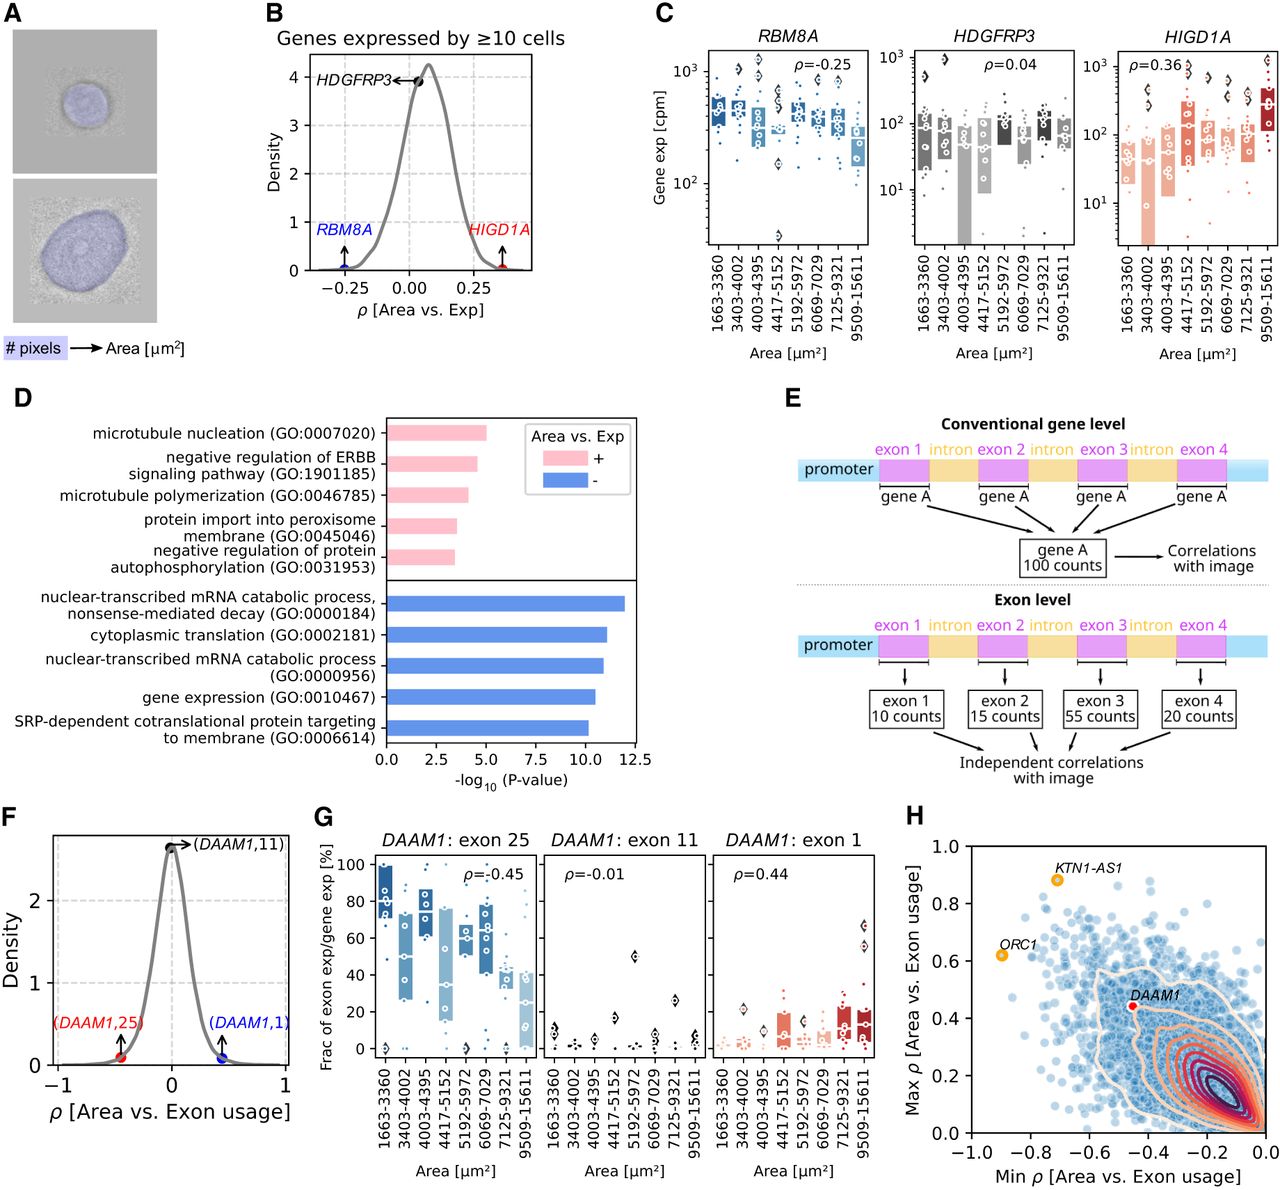
Correlating cell size with gene expression and relative exon usage. (A) Schematic plot of computing cell areas based on the number of pixels. (B) Kernel density estimate (KDE) plot of correlation coefficients between cell area and gene expression for genes expressed by ≥10 cells. Three genes with negative, ∼ zero, and positive correlation coefficients are labeled. (C) Box plots showing the gene expression (cpm) in every 15 cells ranking with cell areas from smallest to largest of genes in B. Each dot represents a cell, and box color is coded by the median expression in each bin. Box plots’ horizontal lines indicate the first, second (median), and third quartiles. Spearman's ρ-values: RBM8A = 0.006, HDGFRP3 = 0.695, and HIGD1A = 5.52 × 10⁻⁵. (D) The top five Gene Ontology terms among 300 genes with highest positive or negative correlation coefficients with cell areas. Genes that are expressed with less than 10 cells are filtered out. (E) Schematic plot of transcriptomic analysis at gene level and exon level. (F) KDE plot of correlation coefficients between cell area and exon usage on exons from genes expressed by ≥10 cells. Three exons within one gene with negative, ∼ zero, and positive correlation coefficients are labeled. (G) Box plots showing the exon usage in every 15 cells ranking with cell areas from smallest to largest. Each dot represents a cell, and color is coded by the median usage in each bin. Box plots’ horizontal lines indicate the first, second (median), and third quartiles. Spearman's ρ-values: (DAAM1: exon 25) = 4.23 × 10⁻⁵, (DAAM1: exon 11) = 0.906, and (DAAM1: exon 1) = 6.05 × 10⁻⁵. (H) Scatterplot of the maximum (y-axis) and minimum (x-axis) correlation coefficients between exon usage and cell area within a gene. Genes that are expressed with less than 10 cells are filtered out. Gene DAAM1 in G is labeled as red. Genes with smallest minimum correlation coefficient and largest maximum correlation coefficient are labeled with orange circles.