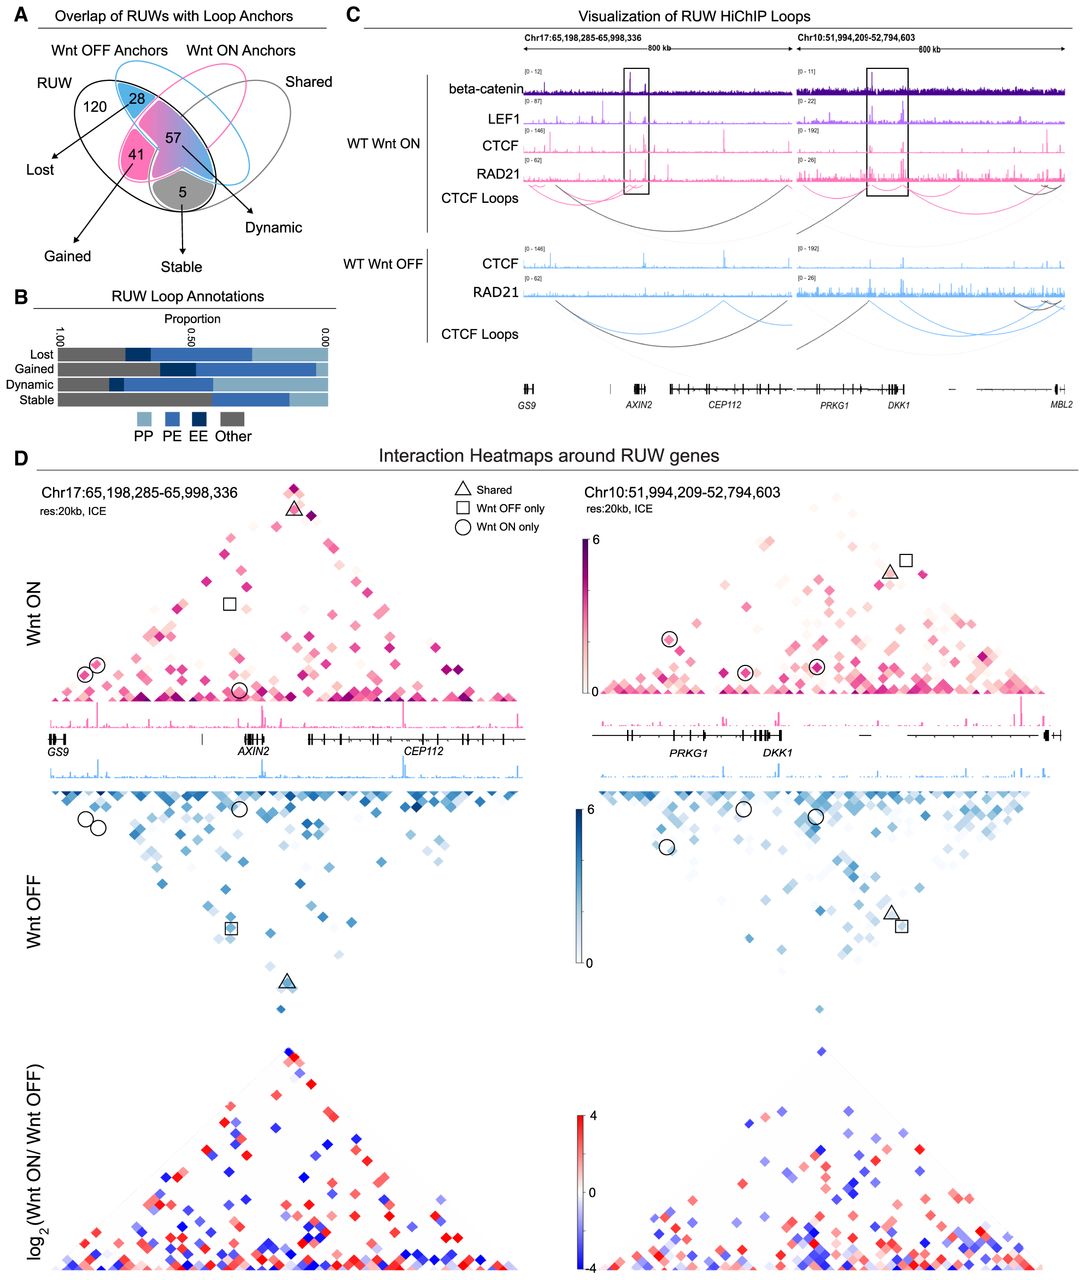
Wnt activation induces changes in CTCF loops around Wnt target genes. (A) Venn diagram showing overlap of RUW peaks with CTCF HiChIP loop anchors. (B) Annotations of RUW loops as P-P, P-E or E-E loops, where P and E denotes promoter and enhancer, respectively. (C) Visualization of Wnt-ON-only CTCF loops associated to RUW peaks at the AXIN2 and DKK1 loci. Wnt-ON-only loops are coloured in pink, Wnt-OFF-only loops in blue, and shared loops in black. Wnt-ON-only loops at the AXIN2 and DKK1 promoters are highlighted within black boxes. (D) CTCF HiChIP interaction matrixes for Wnt-OFF and Wnt-ON (20 kb resolution with ICE normalization, max pixel value 6) alongside corresponding CTCF CUT&RUN tracks. Some differential interactions are highlighted with circles for Wnt-ON-only and squares for Wnt-OFF-only interactions, whereas triangles are shared interactions. The differential matrix (bottom) represents log2 (Wnt-ON/Wnt-OFF) interactions, such that red indicates enrichment in Wnt-ON and blue enrichment in the Wnt-OFF condition.