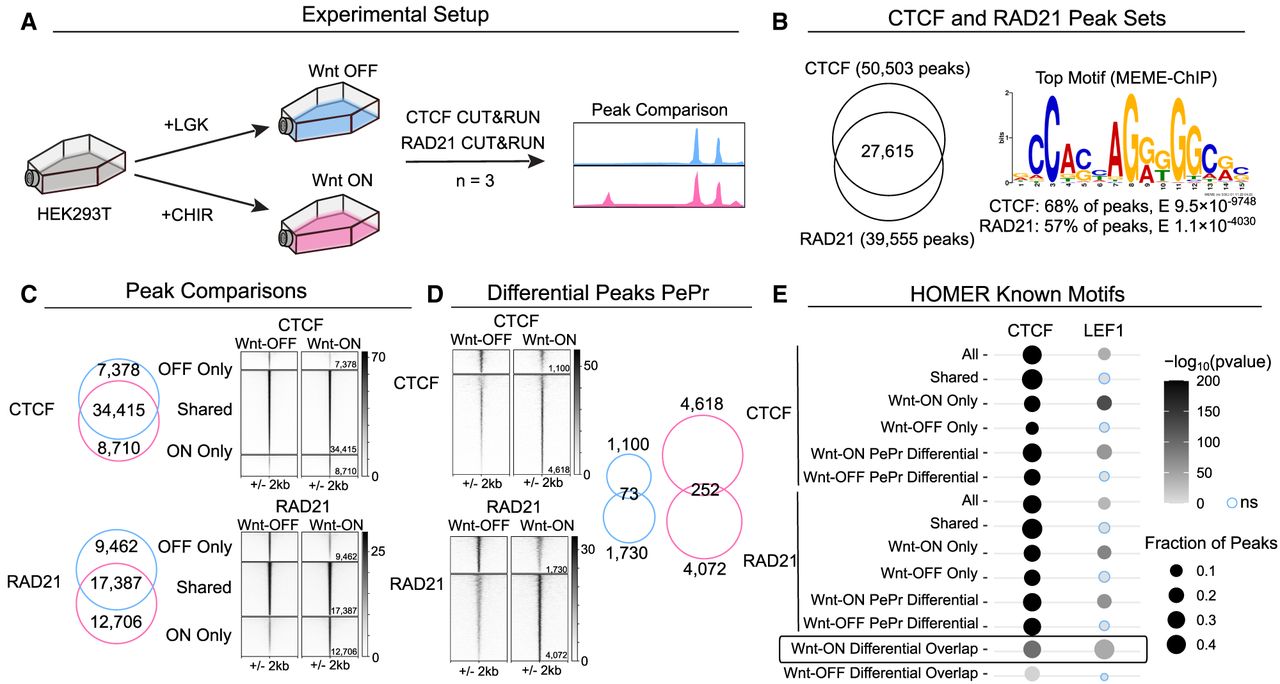
CUT&RUN of CTCF and RAD21 binding in Wnt-OFF versus Wnt-ON. (A) Schematic depicting the experimental strategy. LGK was used to induce Wnt-OFF, and CHIR99021 was used to activate Wnt-ON. Three independent biological replicates were performed per condition. (B) Left: Venn diagram showing overlap of CTCF and RAD21 peaks. Right: The top MEME-ChIP motif identified matched CTCF in both CTCF and RAD21 data sets. (C) Left: Venn diagrams showing overlap of Wnt-OFF (blue) and Wnt-ON (pink) peaks for CTCF (top) and RAD21 (bottom). Right: Signal intensity plots of peak subsets. (D) PePr identified differential peaks in Wnt-OFF and Wnt-ON for CTCF and RAD21 and their overlap between CTCF and RAD21 for each condition (right). (E) Known HOMER motif analysis results for all peak subsets, showing significance and percentage of peaks for CTCF and LEF1 motifs. Only Wnt-ON only subsets display LEF1 enrichment.