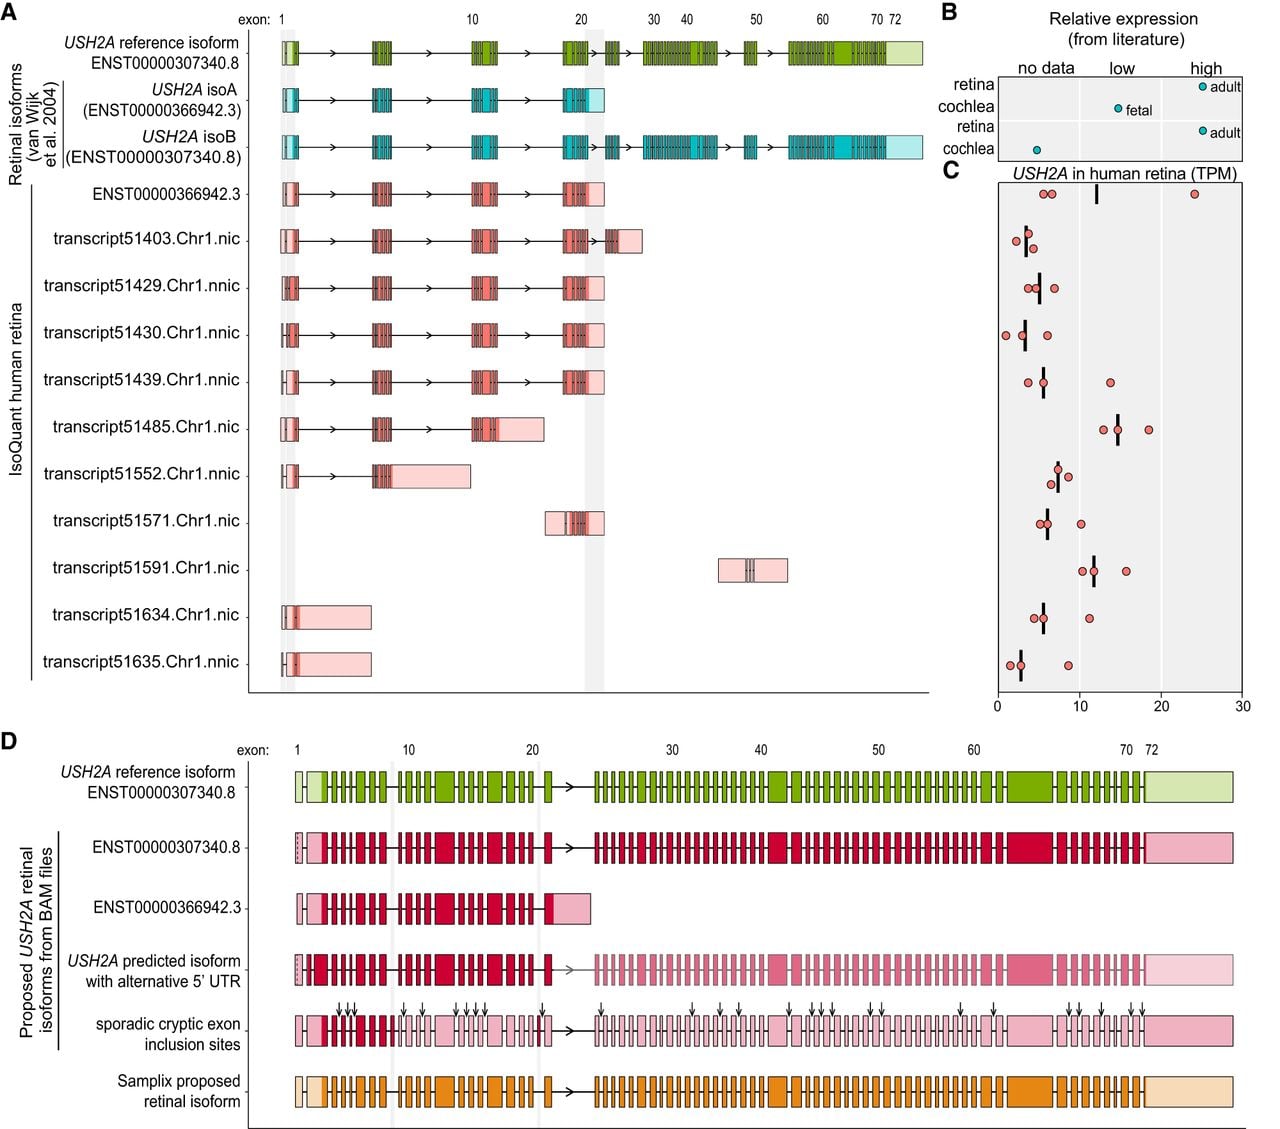
USH2A transcript isoforms were identified by IsoQuant analysis, manual curation, and Samplix Xdrop targeted enrichment. (A) The GENCODE reference transcript is depicted at the top in green, followed by the known human USH2A transcript isoforms in blue (van Wijk et al. 2004). The USH2A IsoQuant transcripts are depicted in red. The light green, blue, and red colors indicate the UTR and the dark green, blue, and red colors indicate the ORF of each transcript. Differences between the IsoQuant transcript isoforms and the GENCODE reference transcript are highlighted in gray boxes. (B) Relative expression of USH2A isoforms based on literature in either the retina or the cochlea. (C) The TPM (based on data set 1) for each IsoQuant transcript are presented for the three individual samples. (D) Proposed USH2A transcript isoforms based on manual curation and Samplix Xdrop targeted enrichment. The GENCODE reference transcript is depicted in green, followed by the proposed USH2A transcript isoforms and events based on manual curation of BAM files using the IGV in red, and the proposed transcript isoform following the Samplix Xdrop targeted enrichment in orange. The light green, red, and orange colors indicate the UTR and the dark green, red, and orange colors indicate the ORF of each transcript. Differences between the proposed transcript isoforms and the GENCODE reference transcript are highlighted in gray boxes. The overview of sporadic incorporation of cryptic exons indicates the presence of PE8 and PE20 as previously described by Reurink et al. (2023). Additionally, locations, where cryptic exons are occasionally incorporated at sites that are not yet associated with deep-intronic pathogenic variants, are indicated with black arrows.