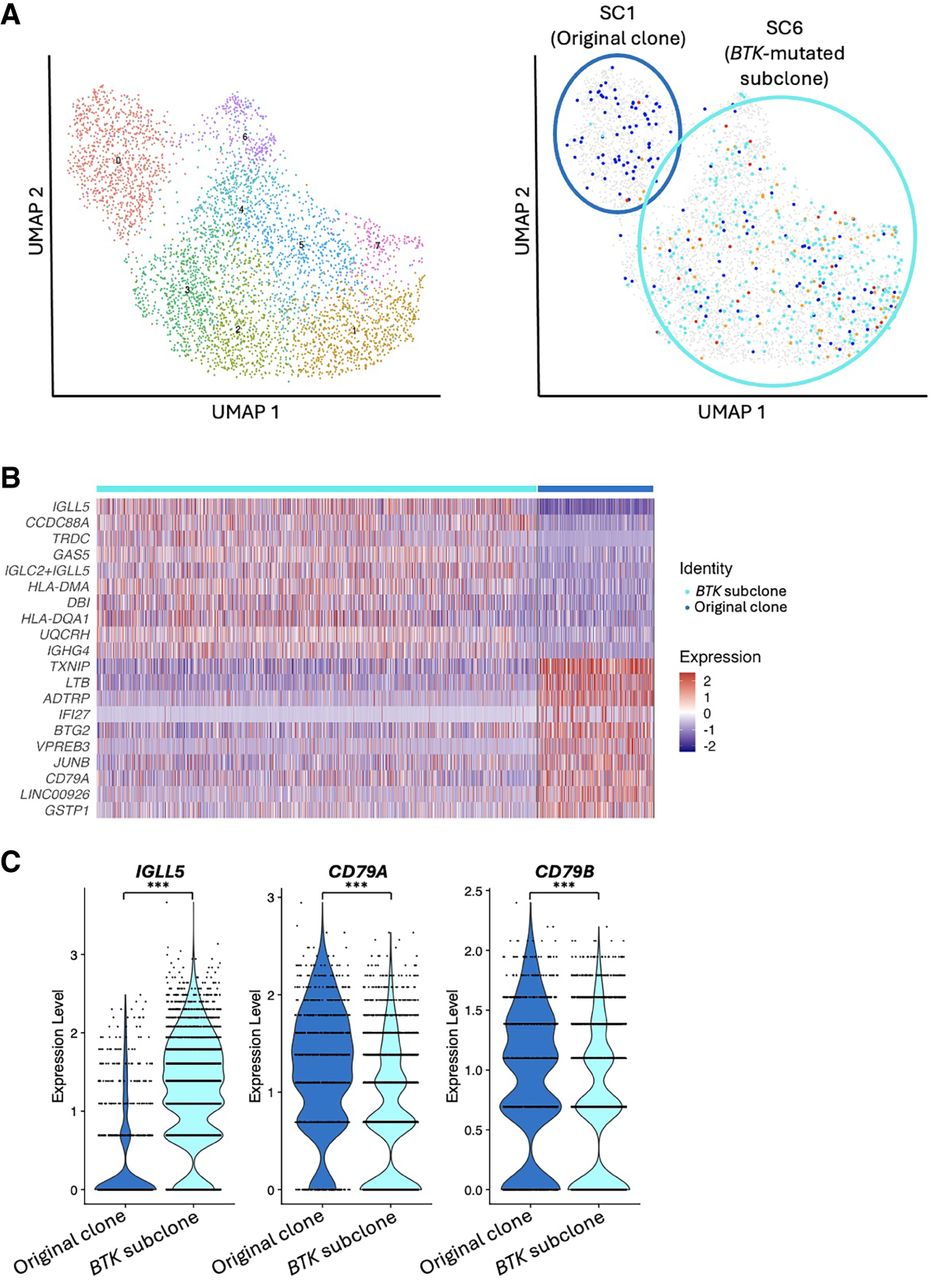
Using cell assignments to identify subclone-specific gene expression patterns. The results shown are from patient 1, who had a linear pattern of subclonal evolution with a BTK mutation present in the final subclone. The pattern of subclonal evolution and genotype matrix plot for this patient are depicted in Figure 4. (A) Mapping subclone assignments to clustered cells enables the identification of phenotypically distinct subclones. (B) Heatmap of differentially expressed genes between the Original clone and the BTK-mutated subclone. The top 10 upregulated genes in each clone are shown. (C) Differential gene expression analysis between subclones illuminates overexpressed and underexpressed genes within the BTK-mutated subclone. (***) adjusted P-value < 0.001.