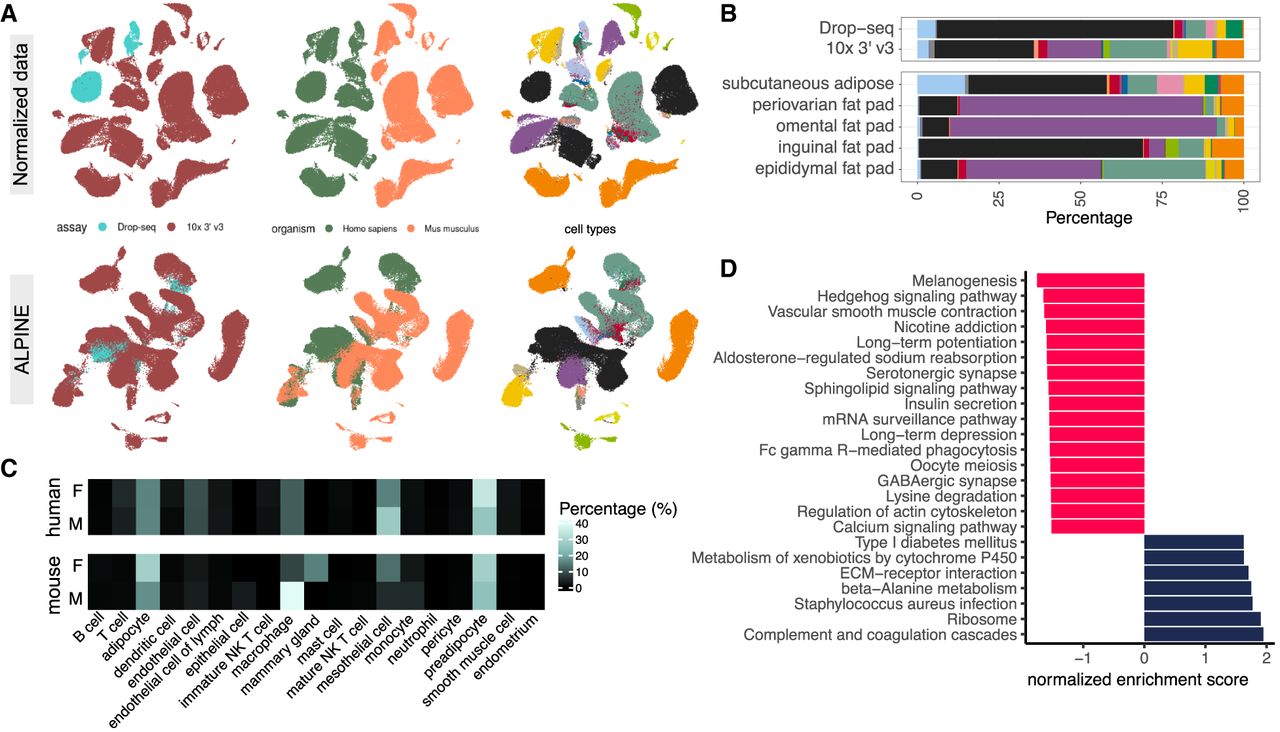
Cross-species analysis in adipose tissue with multicondition analysis. (A) The original data set displays multiple batch and condition effects, with colors indicating various categories. Post-ALPINE application, batch effects from sequencing technologies are removed, resulting in aligned clusters of similar cell types across species, although adipocytes remain distinct due to biological differences. (B) Condition embeddings reveal associations between cell types and assay/tissue labels, accurately capturing expected cell types. Notably, Drop-seq fails to identify fragile adipocytes, which are detectable only via sNuc-Seq. Tissue embeddings further represent accurate cell-type abundances across conditions. The stacked bar plot is color-coded by cell types, consistent with A. (C) Analysis of sex embeddings, separated by species, indicates that human cell compositions are more similar between males and females, whereas mouse samples exhibit significant differences, underscoring the identified sex-related variations. (D) The bar plots display normalized enrichment scores for KEGG terms from the GSEA analysis, comparing human and mouse adipocytes using gene data from Worganism. Positive values (navy bars) indicate higher enrichment in humans, and negative values (red bars) denote higher scores in mice.