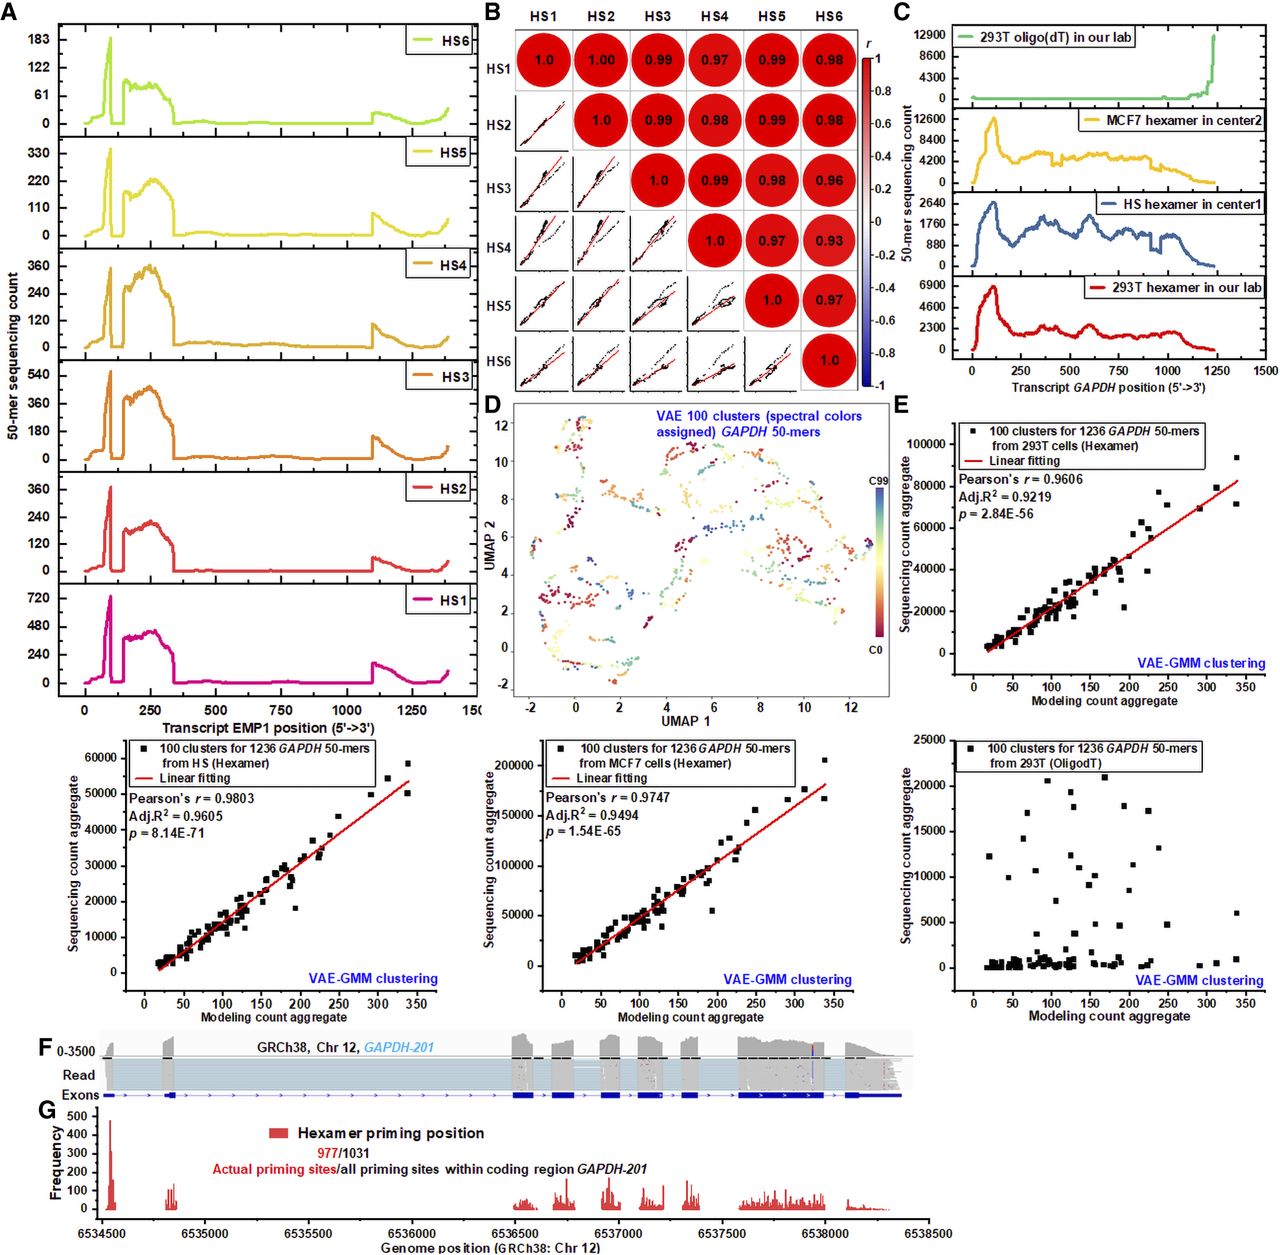
Validation of RNA structure–driven local sequencing efficiency. (A) Stacked plot showing the distribution of 50-mer sequencing counts across the EMP1-211 transcript template in six human colorectal samples. (B) Spearman's correlation plot illustrating the similarity of 50-mer sequencing profiles for EMP1-211 across the six human colorectal samples. (C) Stacked plot of 50-mer sequencing counts for GAPDH-201 in different samples and protocols. Data includes HEK293T and colorectal samples (center1), sequenced with a hexamer-based Ribo-off rRNA depletion protocol, and MCF-7 samples (center2), sequenced with a hexamer-based oligo(dT) mRNA enrichment workflow. Additionally, HEK293T samples were sequenced using an oligo(dT)-induced reverse transcription for total RNA workflow. (D) UMAP visualization of dimensionality reduction for 1236 unique 50-mer sequences from GAPDH-201, clustered into 100 groups using the VAE-GMM algorithm. (E) Scatterplot comparing aggregated sequencing counts and modeled counts for GAPDH-201 50-mer clusters. Sequencing data from HEK293T (hexamer), MCF-7 (hexamer), colorectal samples (hexamer), and HEK293T (oligo[dT]) are plotted against modeled global-frequency aggregates. Linear regression analysis quantifies the relationship between observed and predicted counts, with regression parameters denoting fit accuracy. (F) Coverage plot showing sequencing depth for GAPDH-201 across nine exons, highlighting variations in single-end read alignment to the genomic reference. (G) Hexamer binding site distribution along the GAPDH-201 template. Of 1031 potential unique sites in coding regions, 977 are actively utilized for hexamer priming, initiating reverse transcription.