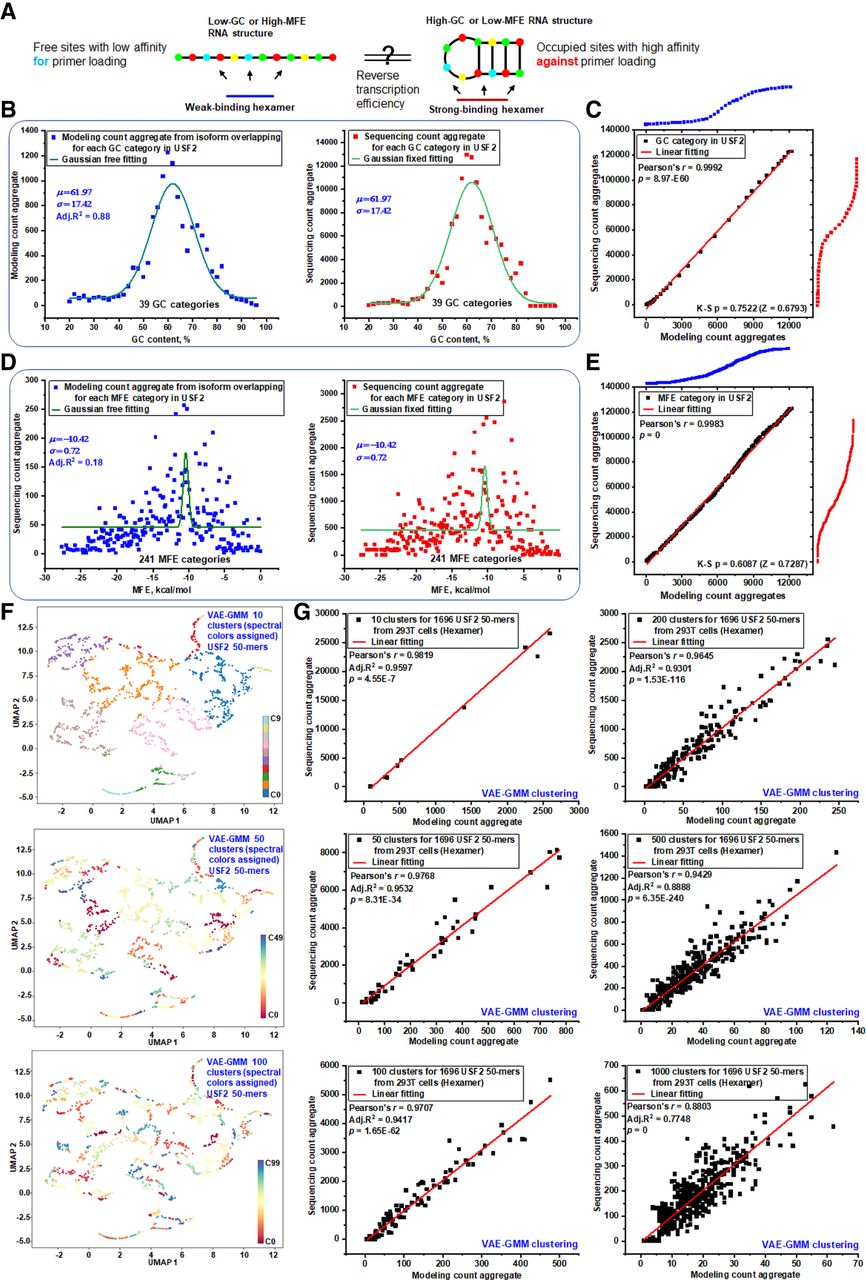
Investigating the impact of RNA structure on local sequencing efficiency at multiple levels. (A) Sequencing efficiency is modulated by RNA structure: low GC-content or high MFE results in weak structural stability and low primer binding affinity. In contrast, high GC-content or low MFE indicates strong structural stability, which inhibits efficient primer loading. (B) Aggregated counts of GC-categorized 50-mers from USF2 (ENST00000222305) were analyzed using global k-mer-overlapping frequency models and empirical sequencing data. Gaussian distributions were applied using a free-fitting method for global frequency-based modeling data to determine key Gaussian parameters and a parameter-fixed fitting method for empirical sequencing data. This analysis highlights discrepancies in 50-mer counts between theoretical predictions and sequencing data within each GC category. (C) P-P plot illustrating the comparison between sequencing count aggregate and modeled count aggregate from panel B. A Kolmogorov–Smirnov test indicates a P-value of 0.7522 (Z = 0.6793) for normalized 50-mer counts, with a linear regression line fitted to the data points. (D) Aggregated counts of MFE-categorized 50-mers were analyzed similarly to panel B using global frequency models and empirical sequencing data. Gaussian distributions were fitted using a free-fitting method to determine Gaussian parameters and a parameter-fixed fitting method to reveal 50-mer count differences between theoretical predictions and actual sequencing data within each MFE category. (E) The P-P plot compares aggregated sequencing counts to modeled counts from panel D. A Kolmogorov–Smirnov test shows a P-value of 0.6087 (Z = 0.7287) for normalized 50-mer counts. A linear regression line fitted to the data points demonstrates consistency between the sequencing data and the MFE-based model. (F) UMAP plots display the clustering results of 1697 USF2 50-mers using VAE-GMM at three levels of granularity: 10, 50, and 100 clusters. Each plot illustrates the distribution of 50-mers across the identified clusters, highlighting the structural diversity within the data set. (G) Modeling predictions and actual sequencing counts were aggregated across VAE-GMM clusters at multiple scales (10, 50, 100, 200, 500, and 1000 clusters). Linear regression analyses were performed for both modeling and sequencing data sets to assess discrepancies between predicted and observed counts, evaluating the accuracy of the clustering models.