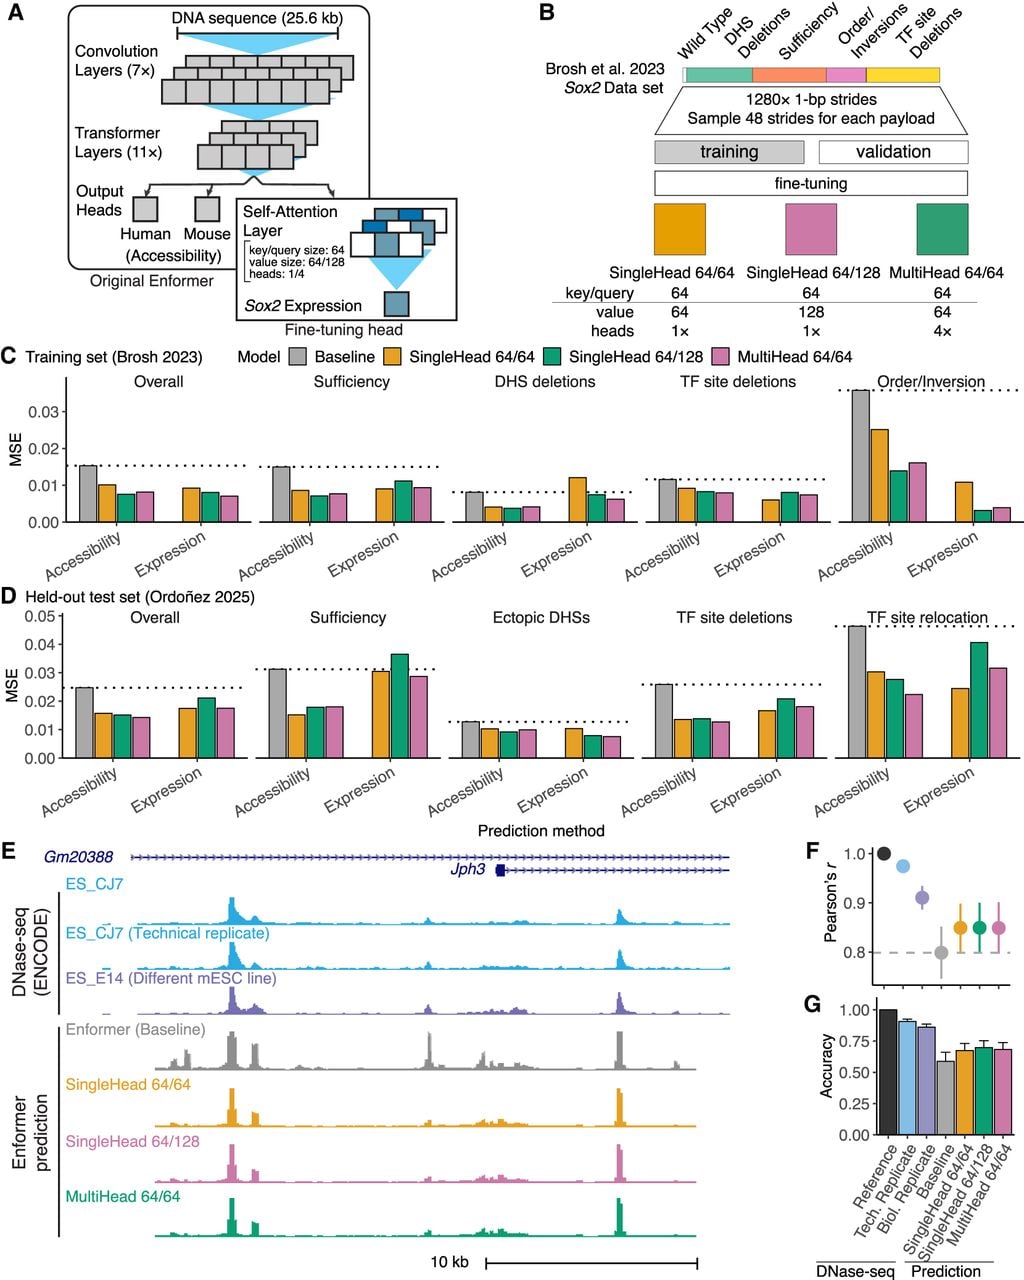
Improved model prediction by incorporating synthetic regulatory genomics data. (A) Enformer fine-tuning architecture. (B) Data set augmentation and training strategy. (C,D) Predictive performance of baseline and fine-tuned Enformer models on training (C) Brosh et al. (2023) and held-out test (D) Ordoñez et al. (2025) sets. Expression was estimated either by summing the maximum predicted accessibility of all LCR DHS (accessibility) or by taking directly from the new output head (expression). MSE, mean-squared error. Results presented for overall data set and payload categories containing more than two payloads. Horizontal dotted lines show baseline performance. (E) Experimental and predicted mESC DNase-seq at the Jph3 locus. Shown is DNase-seq of the prediction target (mESC_CJ7), a technical replicate, an independent cell line (mESC_E14), and accessibility predictions made with baseline and fine-tuned Enformer models. (F,G) Genome-wide predictive performance showing experimental mESC replicates to indicate maximum performance. Error bars indicate ±1 SD. (F) Mean correlation (r) with the prediction target mESC_CJ7 at peaks. Peak signal was measured as the maximum at bins overlapping each hotspot. (G) Mean peak-calling accuracy from predicted signal.