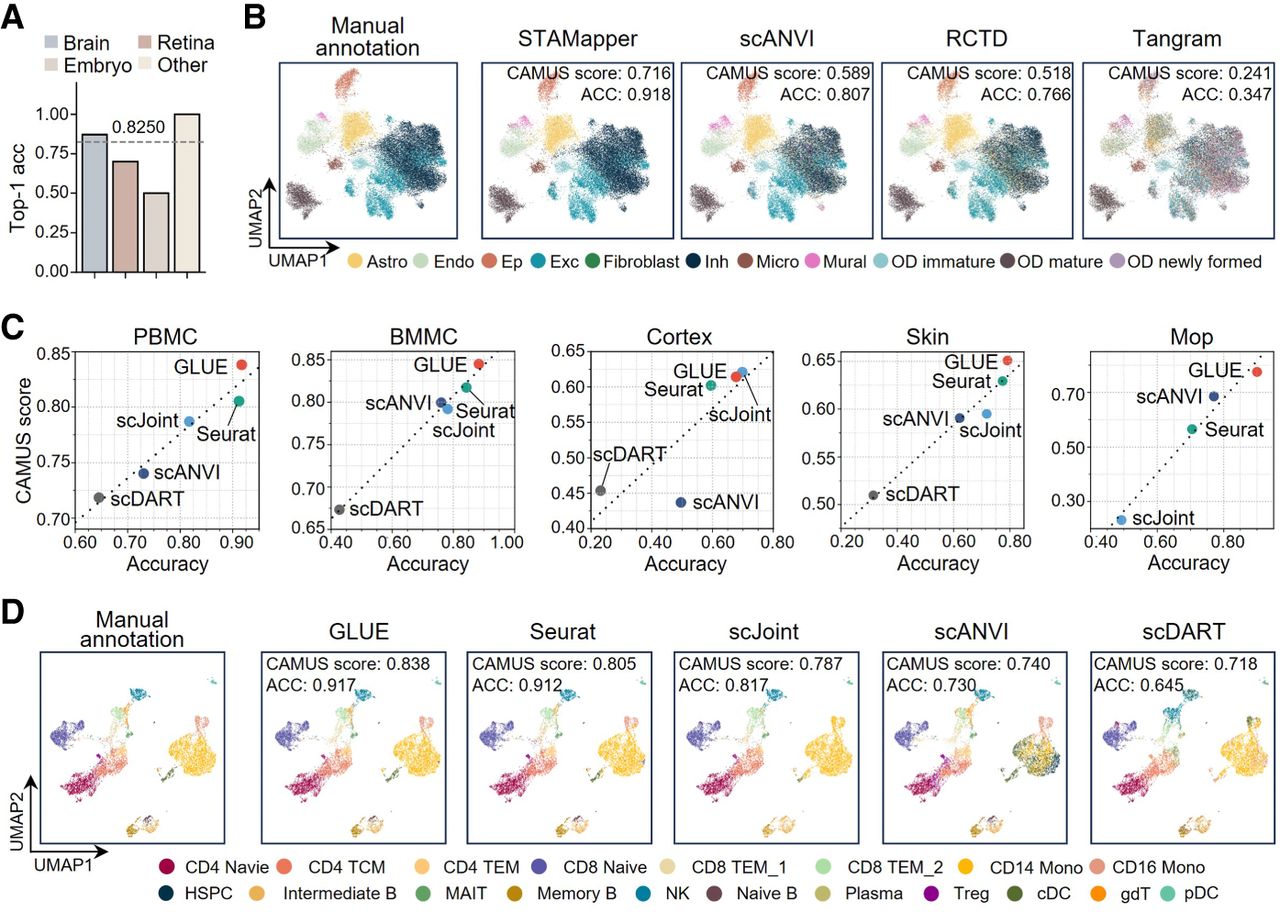
Application of CAMUS to select annotation methods in cross-modalities and in cross-omics cell annotation scenarios. (A) Bar plot showing the top-one accuracy of selecting the best methods by CAMUS for annotating scST data sets. (B) UMAP plots of mouse hypothalamic region scST data set; cells are colored by manual annotation, the annotation of STAMapper, scANVI, RCTD, and Tangram, respectively. (Astro) Astrocytes, (Endo) endothelial cells, (Ep) ependymal cells, (Exc) excitatory neurons, (Inh) inhibitory neurons, and (OD) oligodendrocyte. Here, ACC refers to accuracy. (C) Dot plot showing the positive relationship between CAMUS score and ACC. (PBMC) Peripheral blood mononuclear cells, (BMMC) bone marrow mononuclear cells, (Mop) primary motor cortex. (D) UMAP plots of PBMC scATAC-seq data set; cells are colored according to manual annotations and the annotations by GLUE, Seurat, scJoint, scANVI, and scDART, respectively.