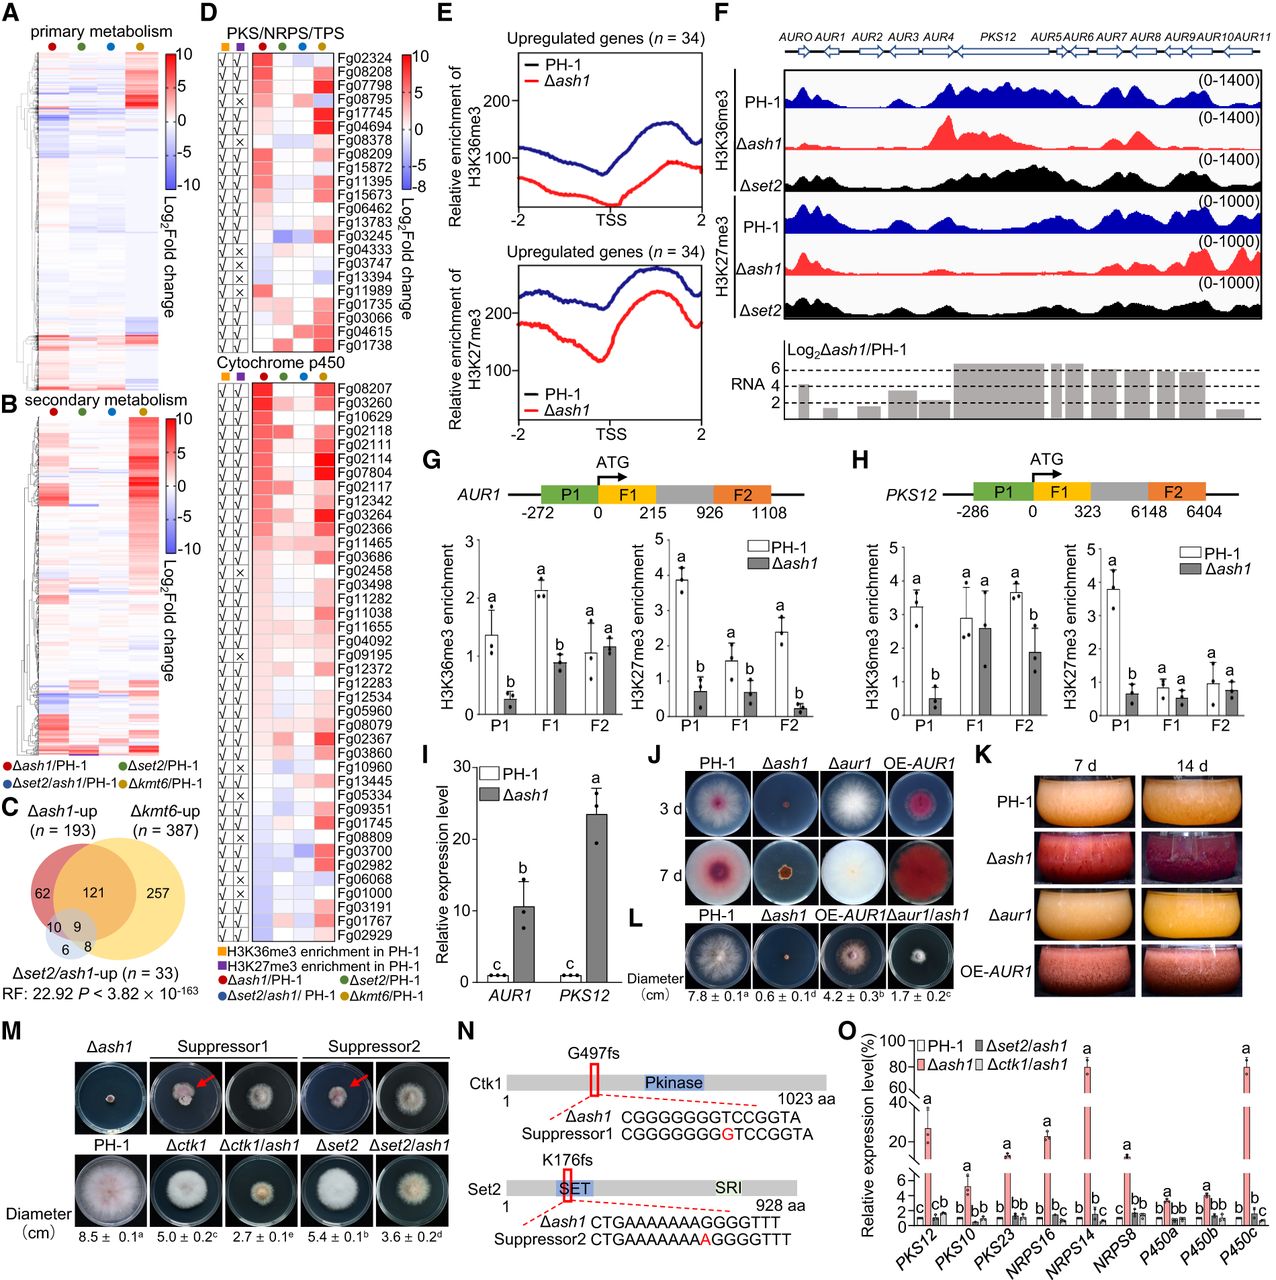
Ash1 regulates secondary metabolism via H3K36me3-H3K27me3 interplay. (A,B) Heat maps of transcript changes in primary metabolism (A, n = 2590) and secondary metabolism (SM) genes (B, n = 683) across mutants. (C) Overlap of upregulated SM genes in Δash1 and Δkmt6. (D) Heat maps of PKS, NRPS, and P450 expression changes in mutants. H3K36me3 and H3K27me3 enrichment in PH-1 is marked (√, enriched; ×, not enriched). (E) Metagene plots of average H3K36me3 and H3K27me3 in PH-1 and Δash1 over upregulated gene from D (±2.0 kb). (F) IGV tracks of H3K27me3 and H3K36me3 across cluster C62. Bar graph shows transcriptional changes of genes within the cluster. (G,H) ChIP-qPCR analysis of H3K36me3 and H3K27me3 enrichment at the promoter (P1), 5′ (F1), and 3′ (F2) region of AUR1 (G) and PKS12 (H) in PH-1 and Δash1. Different letters indicate significant differences between PH-1 and Δash1 at each indicated region. (I) Relative expression of AUR1 and PKS12. Expression levels in PH-1 were set to 1, with ACTIN as the internal normalization control. Different letters indicate statistically significant differences among all groups. Error bars, s.d. (n = 3). Student's t-test (P < 0.05). (J,K) Δash1 shows pigment overproduction on CM plates and in liquid cultures. (L) Colony morphologies and diameters of strains grown on CM for 3 days. (M) Suppressor sectors (red arrows). Colony morphologies and diameters of strains grown on CM for 3 days. Data are mean ± s.d. (n = 3). (N) Spontaneous suppressor mutations in CTK1 and SET2. (fs) frameshift. (O) RT-qPCR of representative SM genes in PH-1, Δash1, Δset2/ash1, and Δctk1/ash1 strains. ACTIN served as the normalization control. Different letters indicate statistically significant differences among the strains for each gene. Data in G, H, I, L, M, and O are presented as mean ± s.d. from three independent experiments. Statistical significance (P < 0.05) was determined as follows: Student's t-test was used for pairwise comparisons in G and H, whereas ANOVA followed by Tukey's multiple comparisons test was used for multiple group comparisons in I and O. Error bars, s.d. (n = 3).