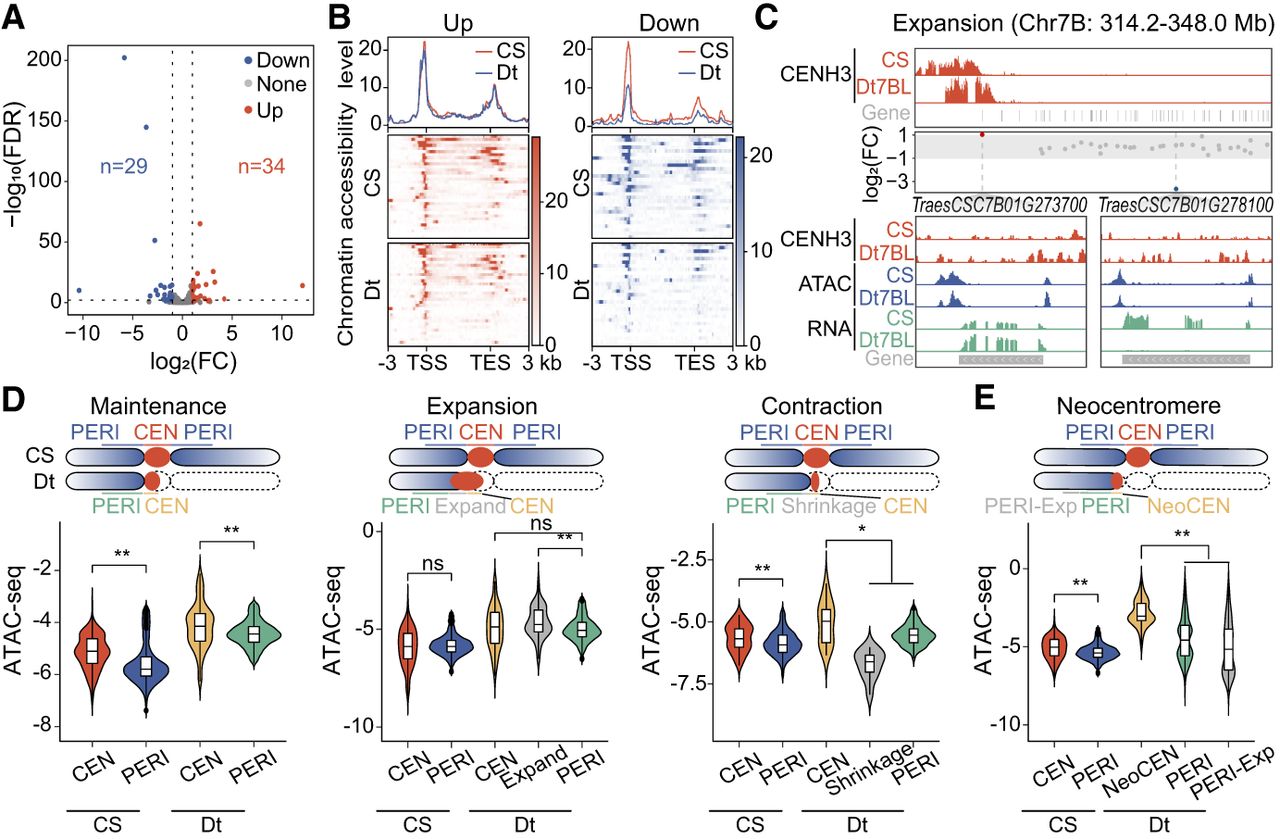
Coordinated changes in gene expression and chromatin accessibility within (peri)centromere regions in wheat ditelosomic lines. (A) Volcano plot showing differentially expressed genes (DEGs) within (peri)centromeric regions in ditelosomic lines compared to CS wheat. Each point represents a gene; red and blue dots denote significantly upregulated and downregulated genes, respectively, based on RNA-seq data. The number of DEGs is indicated for each group. (B) Correlation analysis between chromatin accessibility (measured by ATAC-seq) and gene expression (assessed by RNA-seq) within (peri)centromeric regions. Top panel shows the overall correlation between genes with significant expression changes and their accessibility changes. Bottom panels display the distribution of open chromatin signals across transcription start sites (TSS) and transcription end sites (TES), highlighting shifts in chromatin accessibility patterns. Significantly upregulated and downregulated genes were displayed in left and right panels. (C) IGV snapshots showing RNA-seq and ATAC-seq signal tracks across the centromeric and pericentromeric regions of Dt7BL and CS wheat. Genes with significant expression changes are highlighted: red and blue dots indicate up- and downregulated genes, and gray dots represent those with no significant change. Two example genes, TraesCSC7B01G273700 and TraesCSC7B01G278100, are displayed with enlarged views, showing CENH3 enrichment, chromatin accessibility (ATAC-seq), and transcriptional activity (RNA-seq) between the Dt7BL and CS wheat. (D,E) Comparative analysis of ATAC-seq signal changes between centromeric (CEN) and pericentromereic (PERI) regions within CS and ditelosomic lines under different centromere states, including maintenance, expansion, shrinkage (D), and neocentromere formation (E). The schematic above indicates the specific regions compared in each category, with highlighted regions corresponding to structural transitions. ATAC-seq signal intensity is compared across CS and ditelosomic lines. Statistical significance using Student's t-test: (*) P < 0.05, (**) P < 0.01, (ns) not significant.