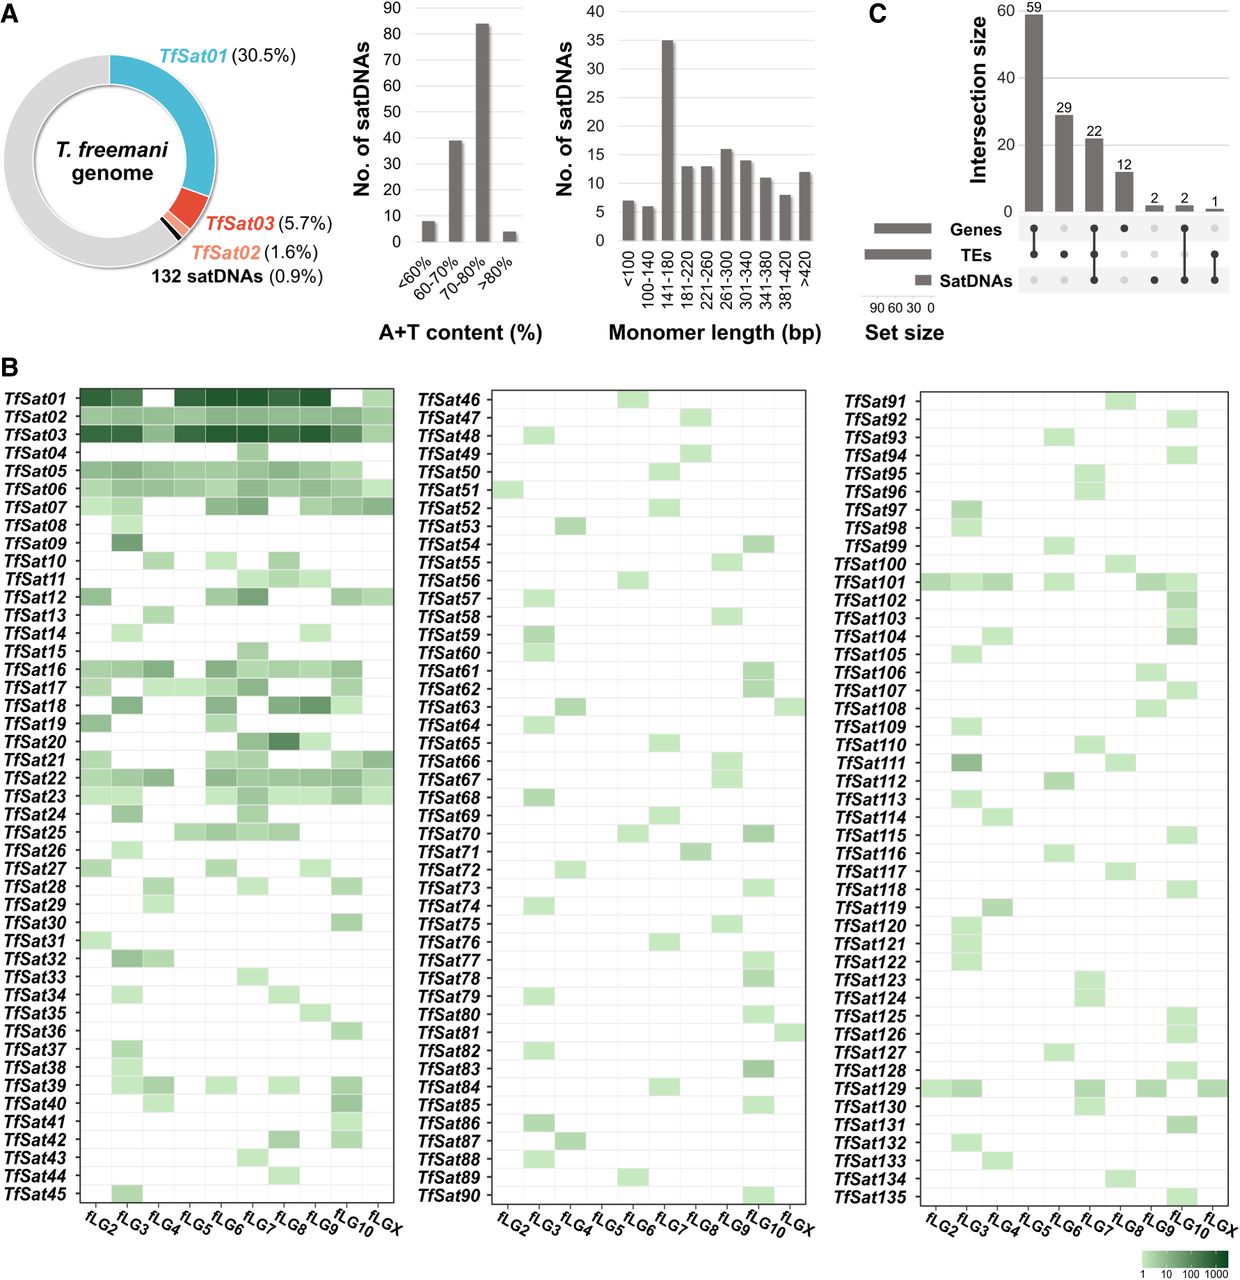
The overview of the T. freemani satellitome comprising 135 satDNAs. (A) The genomic proportions of the three most abundant satDNAs and 132 low-copy-number satDNAs, along with their A+T content and monomer length distribution. The genomic proportions are based on the TAREAN estimates, whereas A+T content and monomer lengths are from individual satDNA data listed in Supplemental Table S3. (B) The presence of satDNA arrays with five or more consecutive copies mapped on the 10 T. freemani chromosomes, fLG2-fLGX, in the Tfree1.0 genome assembly. The number of annotated copies is color-coded according to the color scale. (C) UpSet plot showing the number of the T. freemani satDNAs with annotated genes, transposable elements (TEs), and/or satDNAs within 10-kb flanking regions, based on data in Supplemental Table S6.