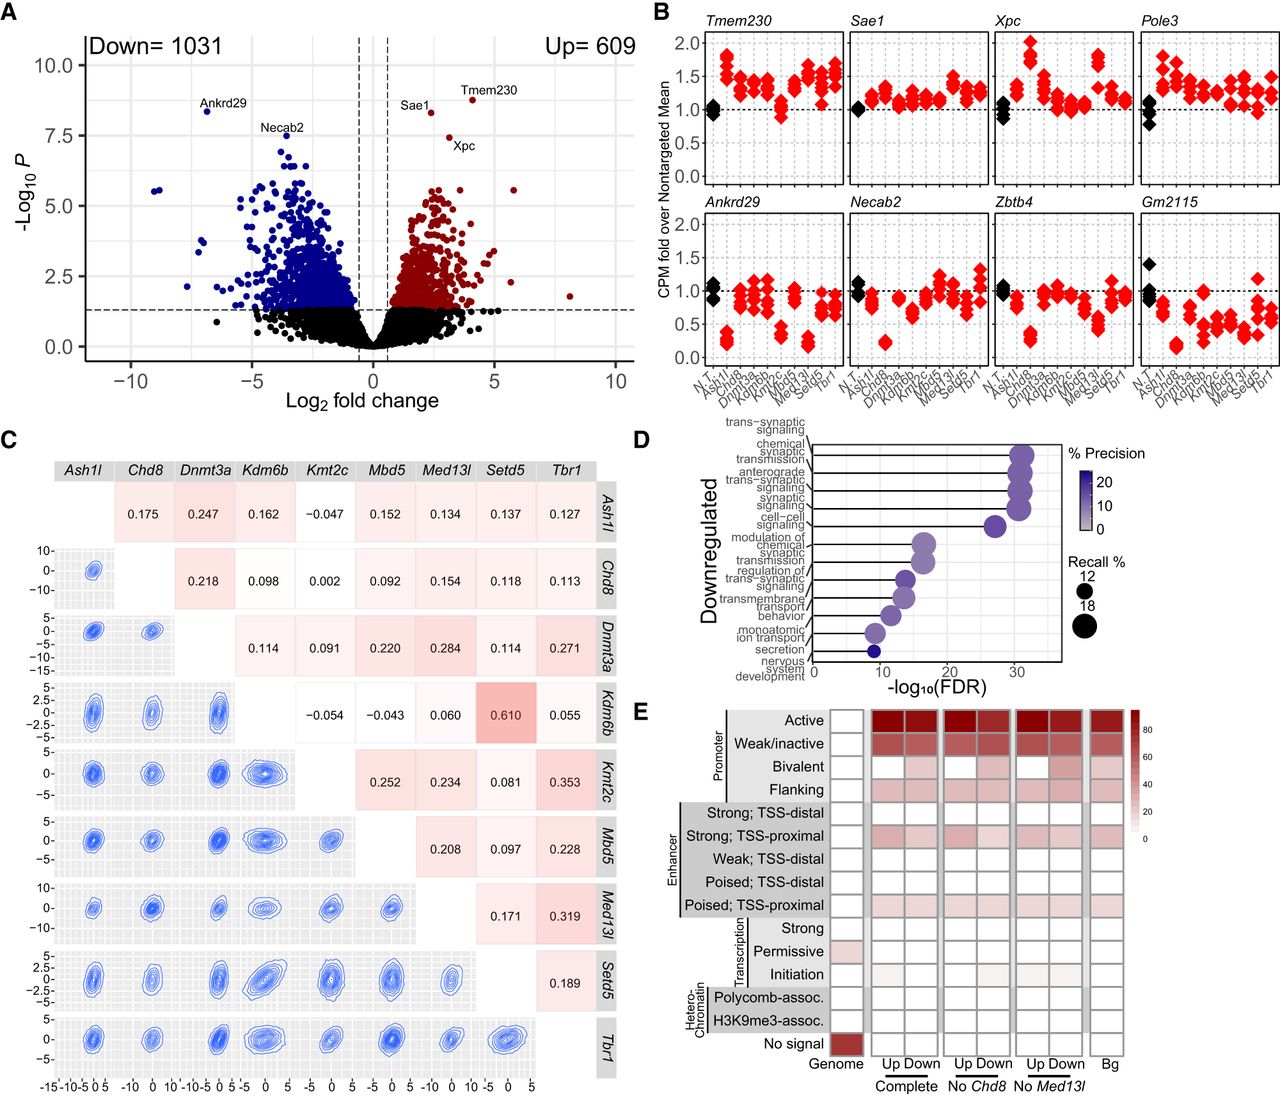
Multiple factor linear modeling with nine independent chromatin modifier depletions in primary mouse neurons. (A) Volcano plot of DEGs from the limma/voom model factoring all nine depletion conditions against a N.T. control. (B) Relative expression of the top DEGs identified in the multifactor model in each depletion versus the average of nontargeting (N.T.)-treated neurons. (C) Cross-correlation plots comparing the overall expression profiles of each depletion against a N.T. control. Heatmap number and colors indicate correlation coefficient. Topography plots show the distribution of expression changes for all genes between any two depletions within their relative contribution to the model. (D) Gene Ontology analysis of significantly downregulated DEGs. Recall is the proportion of functionally annotated genes in the query over the number of genes in the GO term. Precision is the number of genes found in the GO term over the total number of genes in the query. (E) ChromHMM analysis of promoters (500 bp upstream of TSSs) of significantly up- or downregulated genes in the complete model or in the models without Chd8 or Med13l. (Bg) All genes expressed in primary mouse neurons at DIV10.