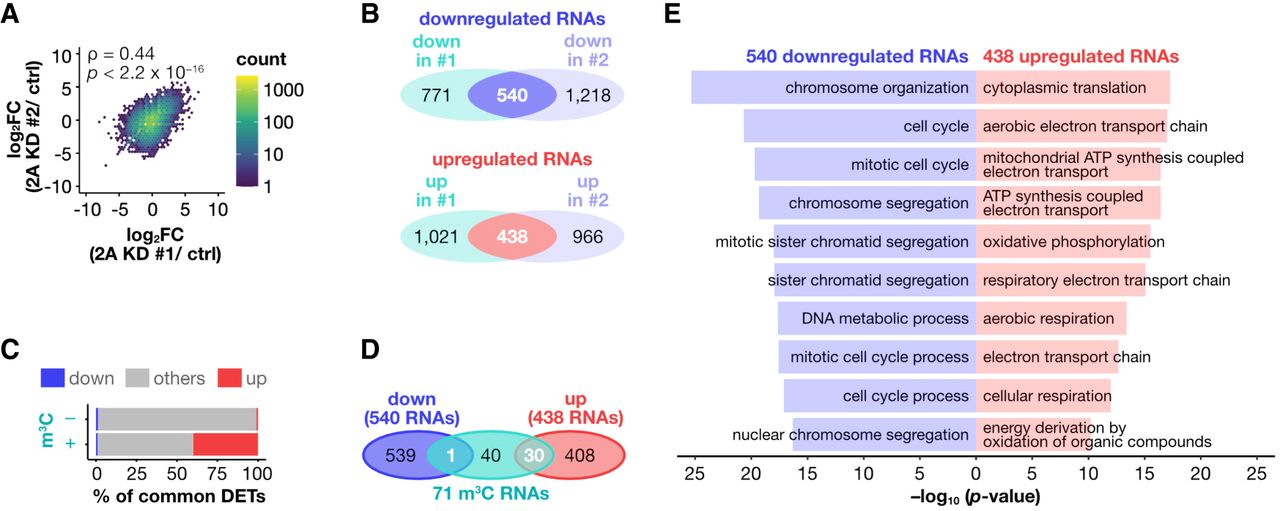
Figure 4.
METTL2A downregulates m3C RNAs. (A) Hexagonal two-dimensional heat map showing the correlation of expression changes between the two siRNAs in the direct RNA sequencing data. Statistical significance was determined by Spearman's correlation test. 2A KD: METTL2A knockdown. (B) Venn diagrams showing the number of transcripts upregulated or downregulated by each siRNA in the direct RNA sequencing data. (C) Stacked bar plots showing the percentage of m3C RNAs and other RNAs. (D) Venn diagrams showing the overlap between m3C RNAs and differentially expressed transcripts following METTL2A knockdown. (E) The top 10 biological processes enriched in the upregulated and downregulated transcripts, in red and blue, respectively.