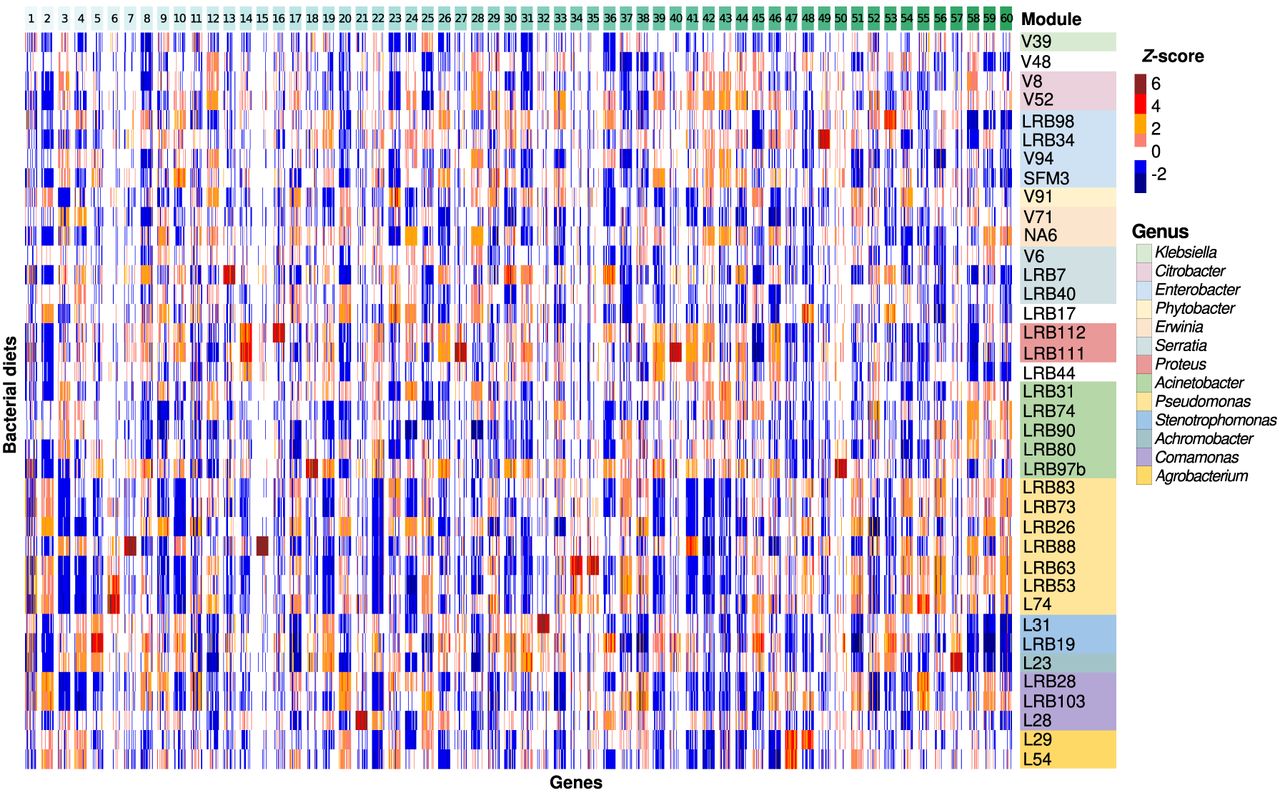
Figure 4.
Expression of modules across the different bacterial diets. The Z-score-normalized expression of the top 60 coexpression modules across the different diets was visualized as a heat map. The expression of the biological replicates was averaged in order to produce a single expression profile for each of the 38 diets. Modules with more than 50 genes were randomly downsampled to aid the visualization of smaller modules and the comparisons between them. Expression patterns were unique for each module and depended on the bacterial diet.