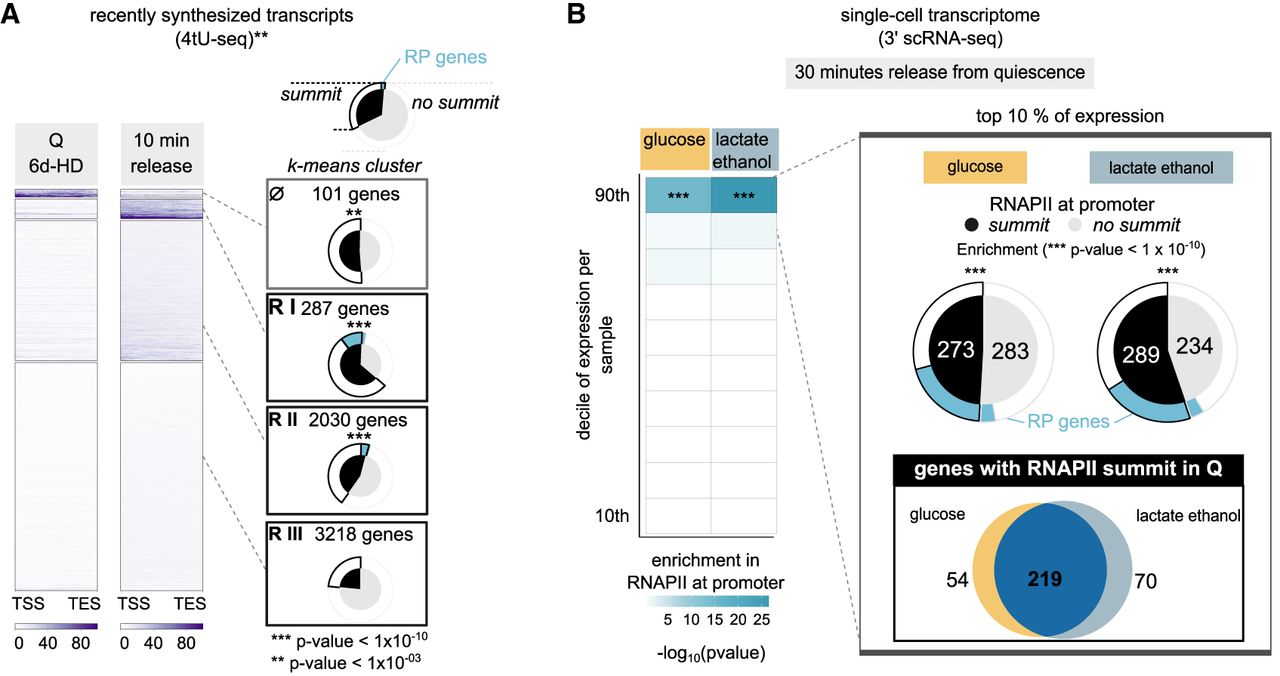
Upstream RNAPII predicts strength of transcriptional restart upon release. (A) k-means clustering of recently synthesized transcripts data ([**] Cucinotta et al. 2021) over TSS–TES. Shown are the number of genes per cluster. Pie charts show the proportion of genes per cluster bearing an upstream RNAPII summit (black). Outer ring shows the proportion of ribosomal protein genes (blue). (***) Gene clusters significantly enriched in RNAPII at promoter. Hypergeometric test; (R-I) 1.14 × 10⁻⁴, (R-II) 2.32 × 10⁻²⁷, (R-III) 3.75 × 10−39, (R-IV) ns. (B) Heatmap of RNAPII enrichment at promoter per decile of expression in single-cell RNA transcriptomes performed 30 min after release in media containing different carbon sources. RNAPII enrichment at promoter was estimated by a hypergeometric test on the proportion of genes with a Rpb3-FLAG peak summit falling in the upstream intergene (P-values shown in Supplemental Fig. S6F). Deciles of expression are based on the number of cells expressing the gene per sample (cells released on media containing either glucose [2%] or lactate and ethanol [0.5%, 2%] as carbon source). Pie charts represent the proportion of genes with (black) or without (gray) a summit in their promoter among the 10% most frequently expressed genes in either condition. Outer ring shows the proportion of ribosomal protein genes (blue), as in A. (***) Significant enrichment in RNAPII summits at the promoter.