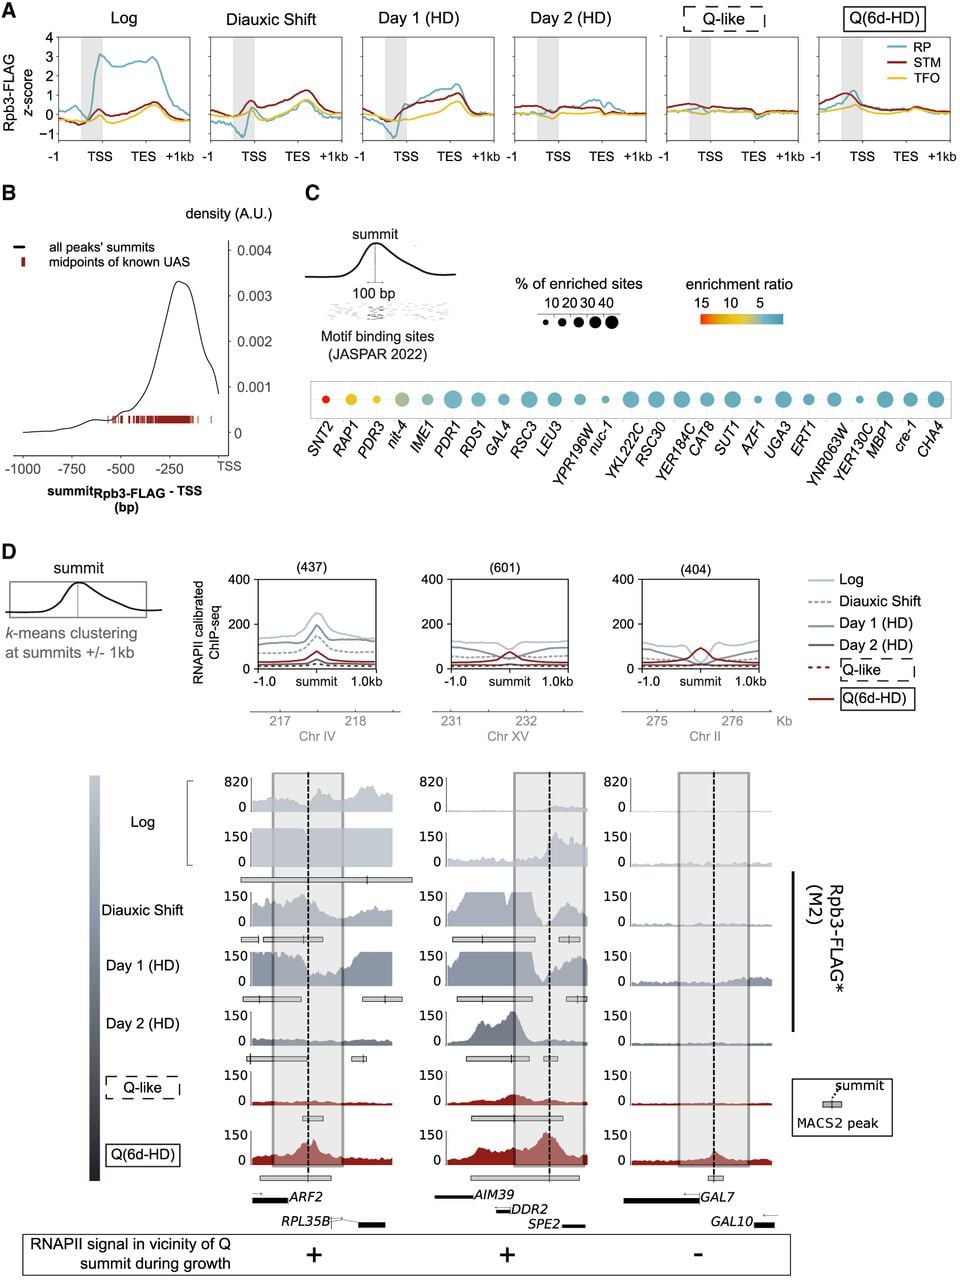
Quiescence-specific intergenic RNAPII accumulates at noncanonical binding sites in promoters. (A) RNAPII distribution over coding sequences at 137 ribosomal protein (RP); 938 SAGA, Mediator, or TUP- bound (STM); and 1783 TF organization lacking STM cofactors but bound by insulators (TFO) genes (Rossi et al. 2021). Rpb3-FLAG signal (z-score) is rescaled over transcription start site (TSS)–TES. (B) Distribution of summits falling in promoter-bearing intergenes relative to TSSs. TSS positions are corrected using CRAC-seq from cycling cells (Candelli et al. 2018). Locations of mapped upstream activated sequences (Schofield and Hahn 2023) are shown as dark red lines. (C) Transcription factor binding sites (TFBSs; from the JASPAR 2022 fungi database) (Castro-Mondragon et al. 2022) found in the vicinity (100 bp) of strongest RNAPII intergenic summits, with a fold enrichment over control greater than three (SEA, MEME suite) (Bailey and Grant 2021). (D) Clustering of Rpb3-FLAG at Q summits ±1 kb. (Top) Average profile plot of RNAPII ChIP-seq (Rpb3-FLAG; this study). Signals are centered at the summits of RNAPII (Rpb3-FLAG) in quiescence falling in promoter-bearing intergenes. Summits are clustered (k-means) into three groups: 437 summits with signal present throughout the kinetics of Q entry, 601 summits with signal locally depleted during growth phase, and 404 summits appearing de novo in the later stages of quiescence entry. (Bottom) Snapshots of Rpb3-FLAG mapping ([*] this study) in fermentation (Log), respiration (postdiauxie, day 1 HD; day 2 HD), or quiescence induced by abrupt starvation (Q-like) or nutrient exhaustion (Q, 6d-HD). Typical examples are shown below each group. Dotted lines indicate the position of the peak summit for each intergene, and gray boxes indicate the region over which the signal was clustered.