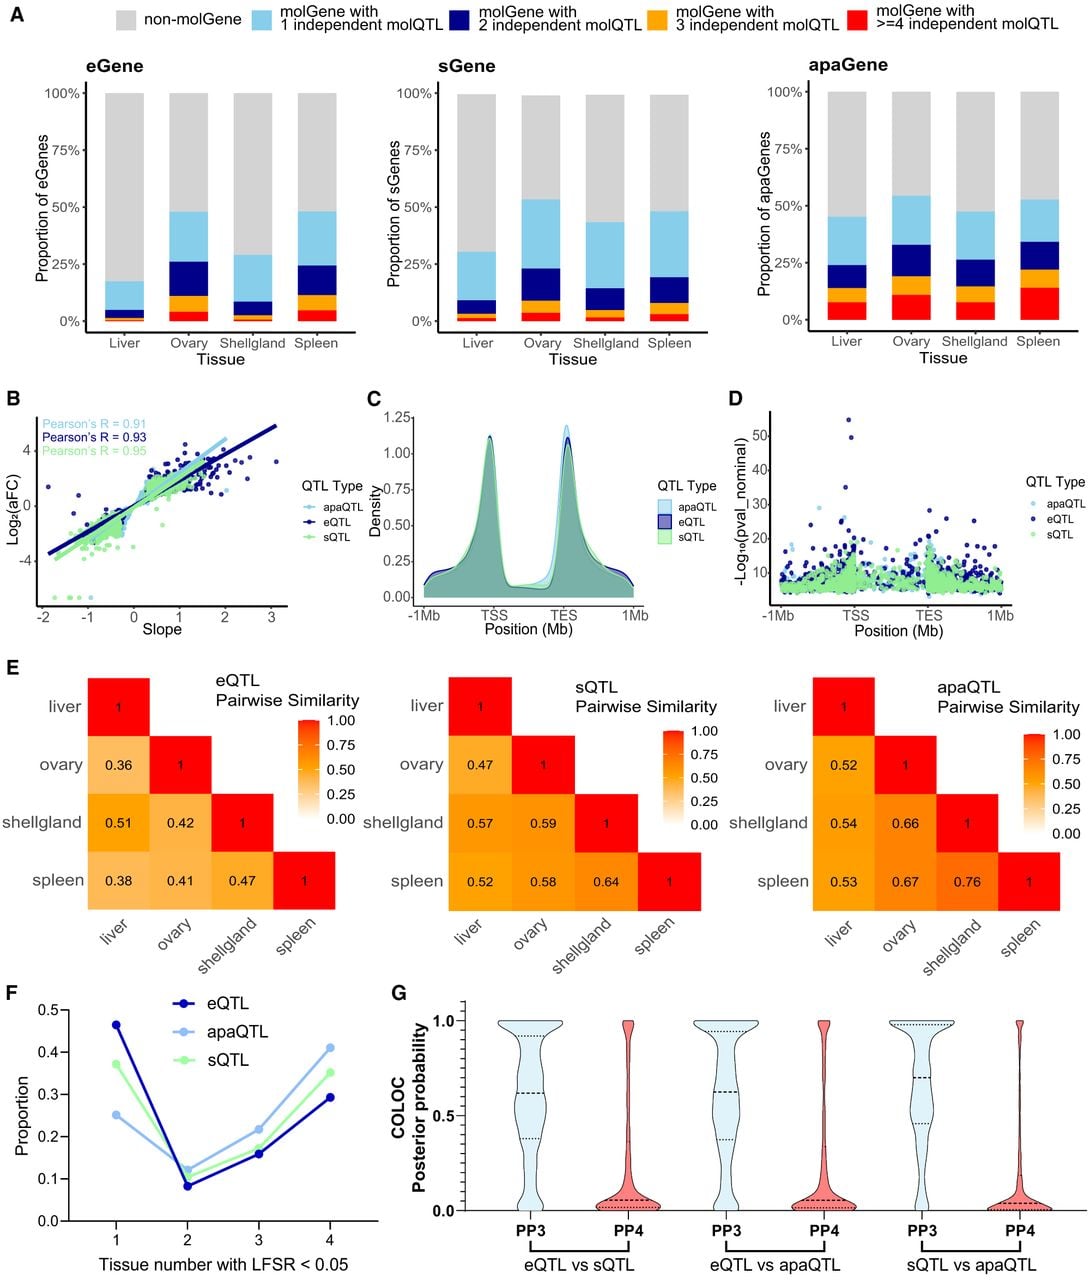
Mapping and characterization of regulatory variants. (A) Proportions of molGenes with different numbers of independent molQTL. From left to right, the panels show the proportions for eGenes, sGenes, and apaGenes across tissues. Bars of different colors represent molGenes with varying numbers of independent molQTL. (B) Correlation between the effect size of molQTL (log2 allelic fold change [aFC]) and the corresponding linear regression slope. (C) Genomic distribution of molQTLs around the gene body. (TSS) transcription start site, (TES) transcription end site. (D) Distribution of molQTL significance (−log10P) within ±1 Mb of the gene body. (E) Tissue sharing of molQTL by effect size magnitude across tissue pairs. From left to right: eQTL, sQTL, and apaQTL. (F) Tissue activity of molQTL. A variant is considered active in a tissue if its local false sign rate (LFSR) is below 0.05. (G) Posterior probabilities of hypothesis 3 (PP3) and hypothesis 4 (PP4) in colocalization analyses between different molQTL from the same gene. The thick dashed line indicates the median, and the thin dashed lines represent the 95% confidence interval.