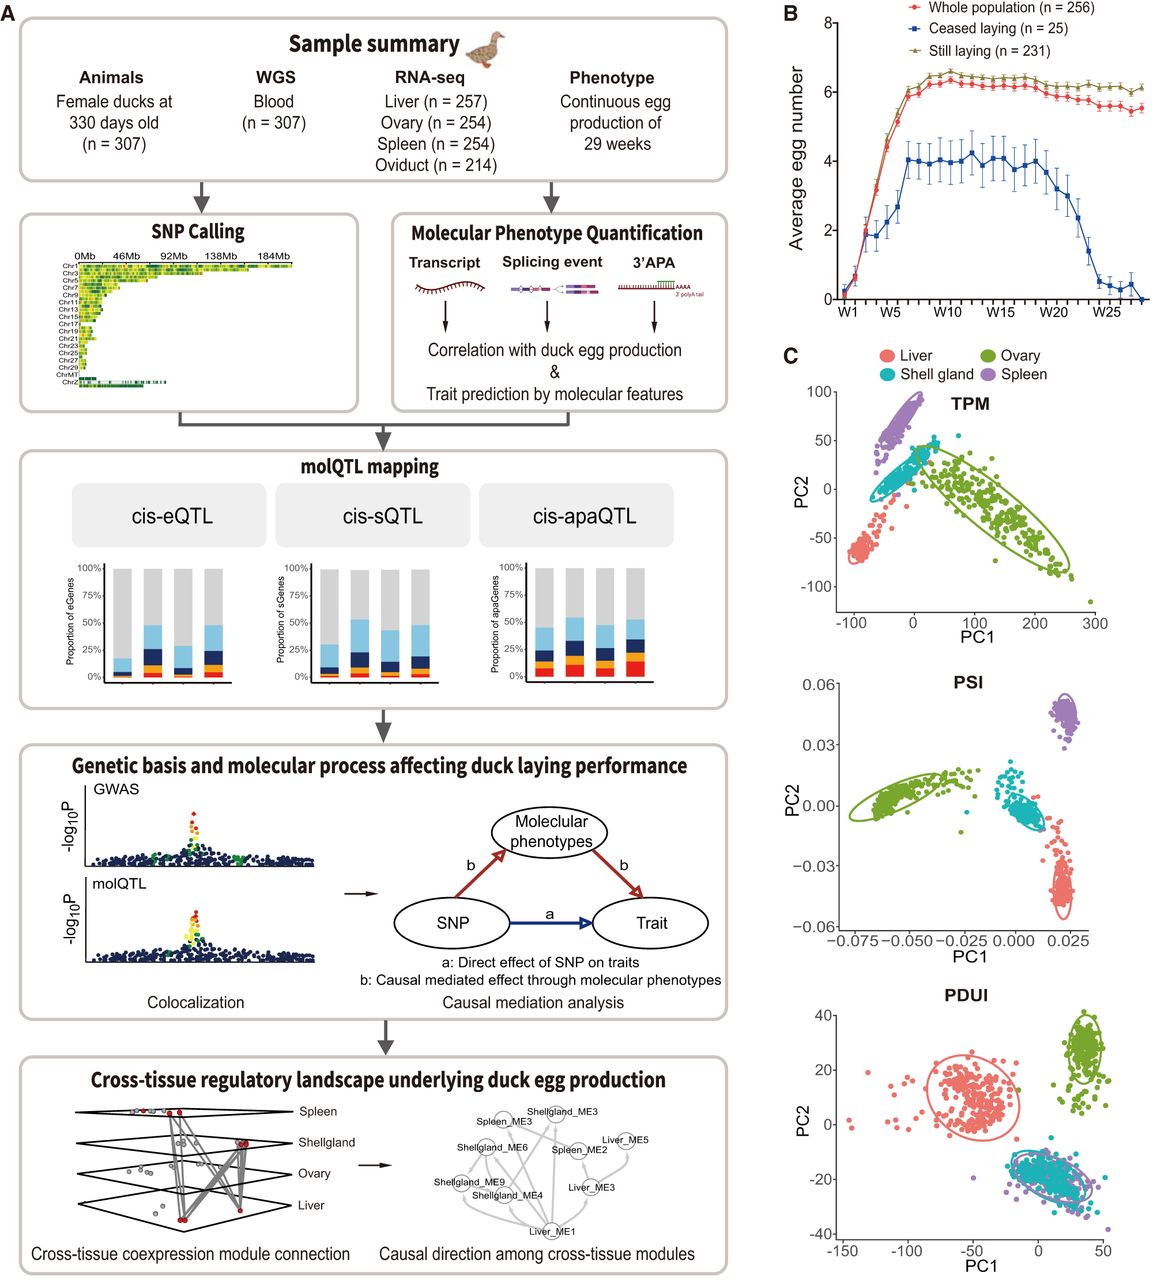
Figure 1.
Data summary. (A) The graphic abstract of current study. (B) The overview of egg productions of each week. The horizontal and vertical axes represent the weeks and average egg production, respectively. (C) The sample clustering by PCA based on the quantification results of different molecular phenotypes. The diagrams from top to bottom represent clustering results based on gene expression, alternative splicing, and 3′APA, respectively.