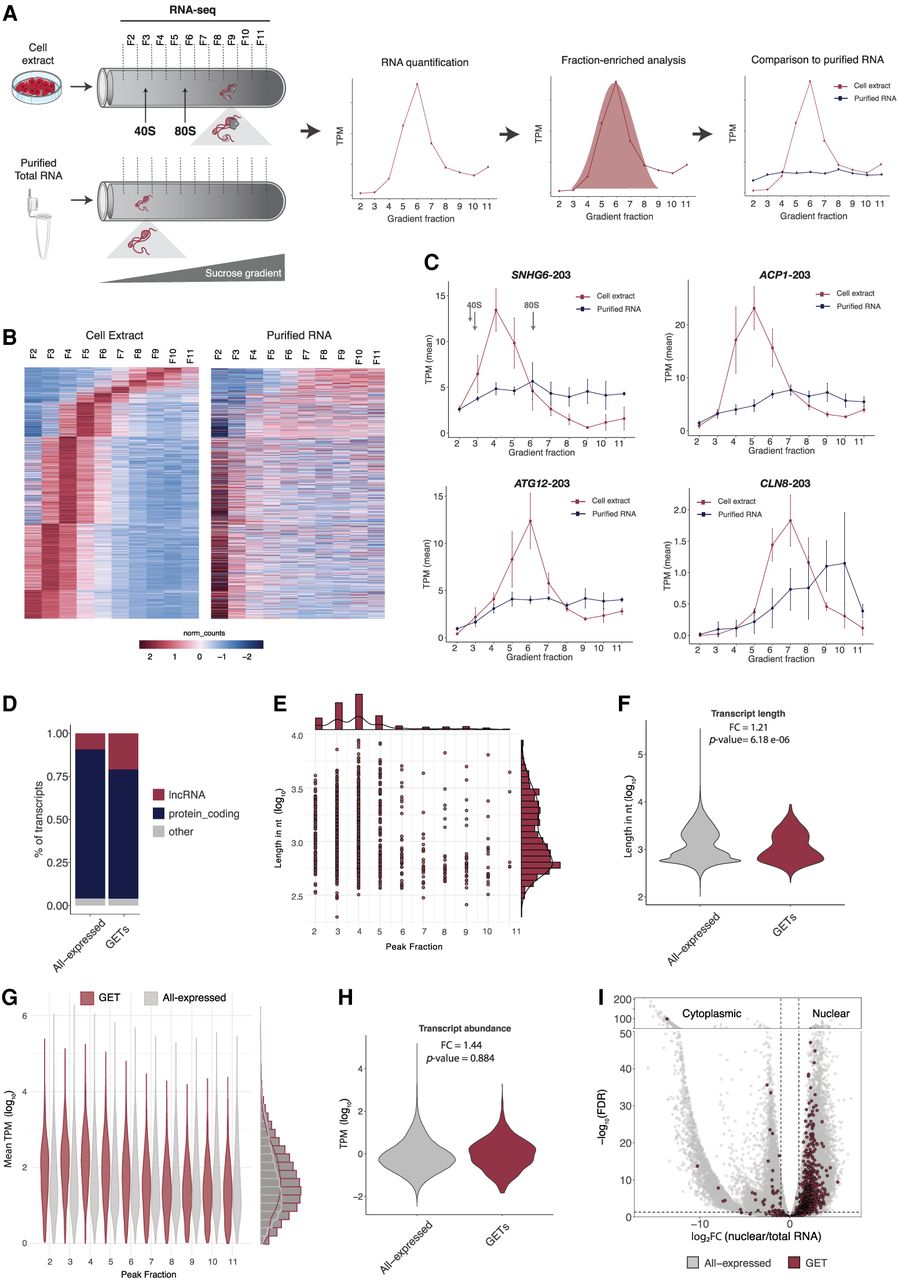
Identification of gradient-enriched transcripts. (A) Schematic representation of experimental approach. Cell extracts or purified total RNA were loaded onto 30%–60% sucrose gradients, followed by centrifugation, fractionation, and RNA sequencing of each gradient fraction. 40S and 80S sedimentation coefficients are indicated for reference. TPM (transcripts per million) gives abundance of a particular RNA transcript per gradient fraction. Distribution of a particular RNA in cell extract (red) and in purified total RNA (blue). (B) Heat map representing the abundance (normalized counts) of RNA transcripts in each gradient fraction of cell extracts and purified RNA gradients. Columns are gradient fractions; rows are RNA transcripts. (C) Examples of GETs and their RNA abundance throughout the gradient. 40S and 80S sedimentation coefficients are indicated for reference. (D) Bar plot of percentage of lncRNAs and protein coding genes in All-expressed and GETs. (E) GET length in nucleotides (log10) in each gradient fraction where GETs showed maximum abundance (peak fraction). On the top and side, bar plots represent the number of events. (F) Distribution of GET length in nucleotides (log10) compared to the other expressed transcripts in the cell (All-expressed). FC: Fold change of median values, P-value: two-sided t-test. (G) GET abundance in TPM (log10) in peak gradient fraction compared to other expressed transcripts in the cell (All-expressed). On the side, bar plots representing the number of events. (H) Distribution of GET abundance in TPM (log10) compared to the other expressed transcripts in the cell (All-expressed). P-value: two-sided t-test. (I) Scatterplot representing the nuclear to total ratio of RNA abundance and indication of nuclear or cytoplasmic localization. Fisher's exact test: P-value < 2.2 × 10⁻¹⁶.