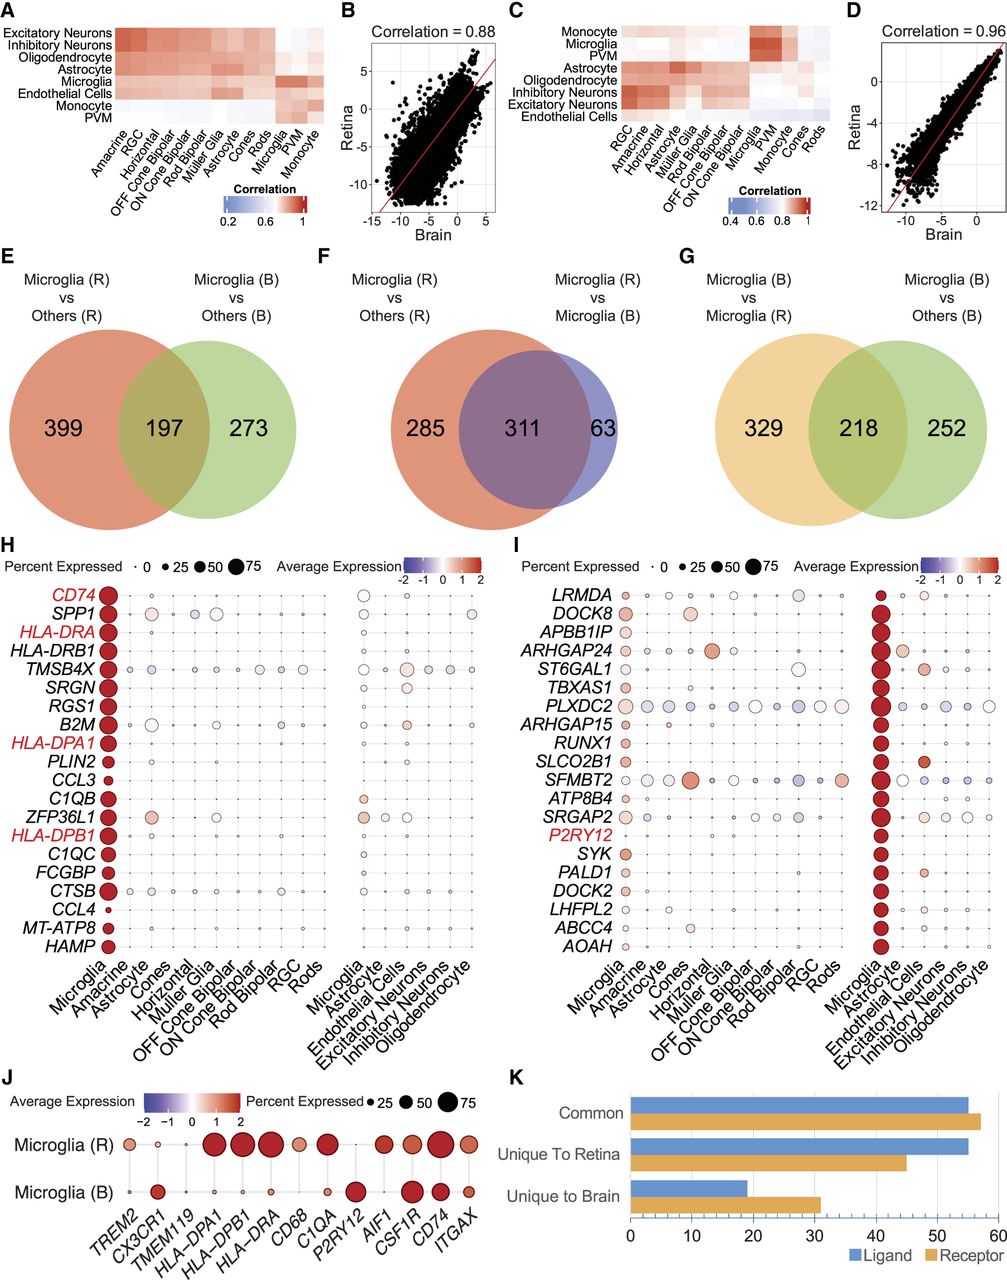
Molecular similarities and differences in retina and brain microglia. (A) Correlation heatmap of gene expression between retina and brain cell types from snRNA-seq data. The color scale ranges from blue (low correlation) to red (high correlation). Column labels correspond to retina cell types, and row labels represent brain cell types. (B) XY plot depicting the log2-transformed gene expression profiles of microglia from the retina (y-axis) and brain (x-axis). The correlation coefficient, displayed at the top of the plot. (C) Heatmap of correlations from the inferred gene activity matrix in snATAC-seq data, with a color scale from blue (low) to red (high). (D) XY plot of log2-inferred gene activity from ATAC-seq chromatin accessibility profiles for the retina (y-axis) and brain (x-axis) microglia, with the correlation coefficient at the top denoting their similarity. (E) Venn diagram illustrating the overlap between 596 retina microglia–specific genes (compared with other retina cell types) and 470 brain microglia–specific genes (compared with other brain cell types). (F) Venn diagram illustrating the overlap between 596 retina microglia–specific genes (vs. other retina cell types) and 374 genes upregulated in retina microglia compared with brain microglia (differentially expressed genes between brain and retina microglia). (G) Venn diagram showing the overlap between 470 brain microglia–specific genes (vs. other brain cell types) and 547 genes upregulated in brain microglia relative to retina microglia (differentially expressed genes between brain and retina microglia). (H) Dot plot showing scaled gene expression of the top 20 genes upregulated in retina microglia compared with other retina cell types and brain microglia. (I) Dot plot of the top 20 genes upregulated in brain microglia compared with other brain cell types and retina microglia. (J) Dot plot displaying marker genes for microglia, with the top panel representing retina microglia and the bottom panel representing brain microglia. (K) Bar plot illustrating the number of shared and unique ligands and receptors between retina and brain microglia. (RGC) Retinal ganglion cell.