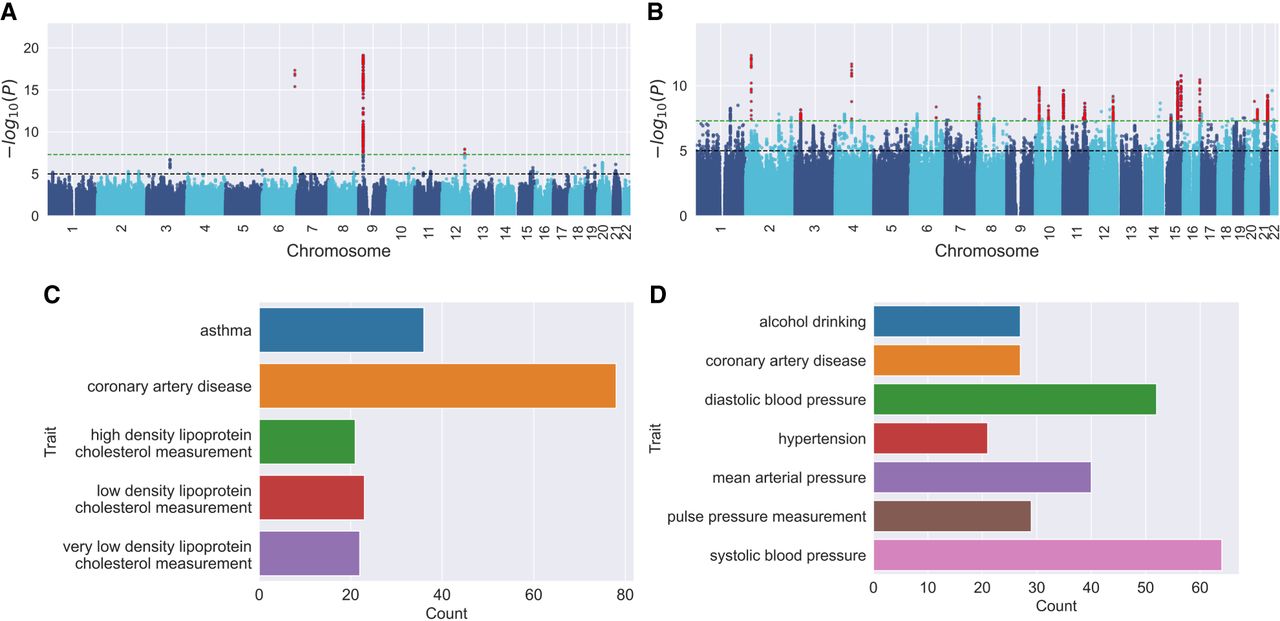
Figure 4.
Comparing significant associations between MaSk-LMM and Regenie with Manhattan plots and mapped traits. (A) Manhattan plot for CAD; (C) Bar chart of CAD traits mapped to significant associations shared with Regenie; (B) Manhattan plot for HYP; (D) Bar chart of HYP traits mapped to significant associations shared with Regenie. The significant variants discovered by both MaSk-LMM and Regenie (11) colored in red.