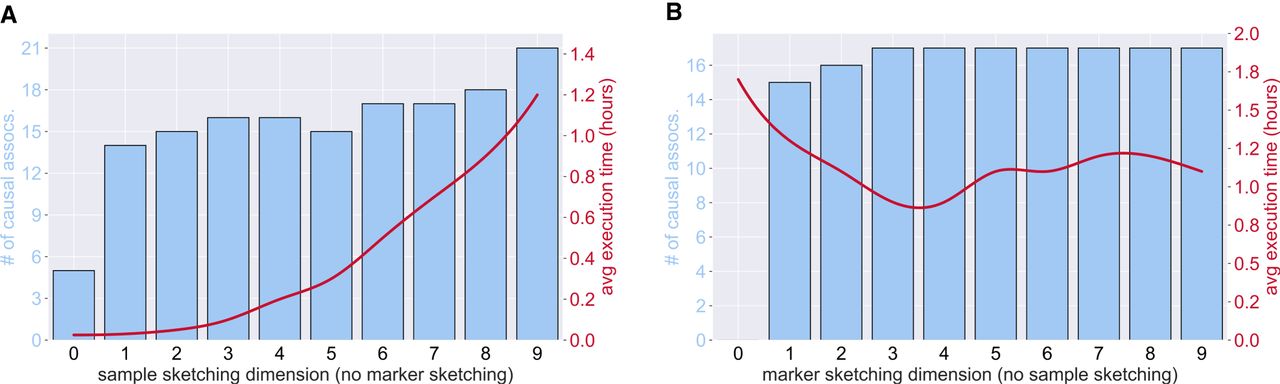
Figure 3.
Average number of causal associations and execution time of MaSk-LMM applied to D1 (British–Irish data with 10k samples and 265k SNPs) for varied sketch dimensions across 20 identical runs. (A) Applying no marker sketching and varying the sample sketching from 0.1 to 1.0. (B) Applying no sample sketching and varying the marker sketching from 0.1 to 1.0.