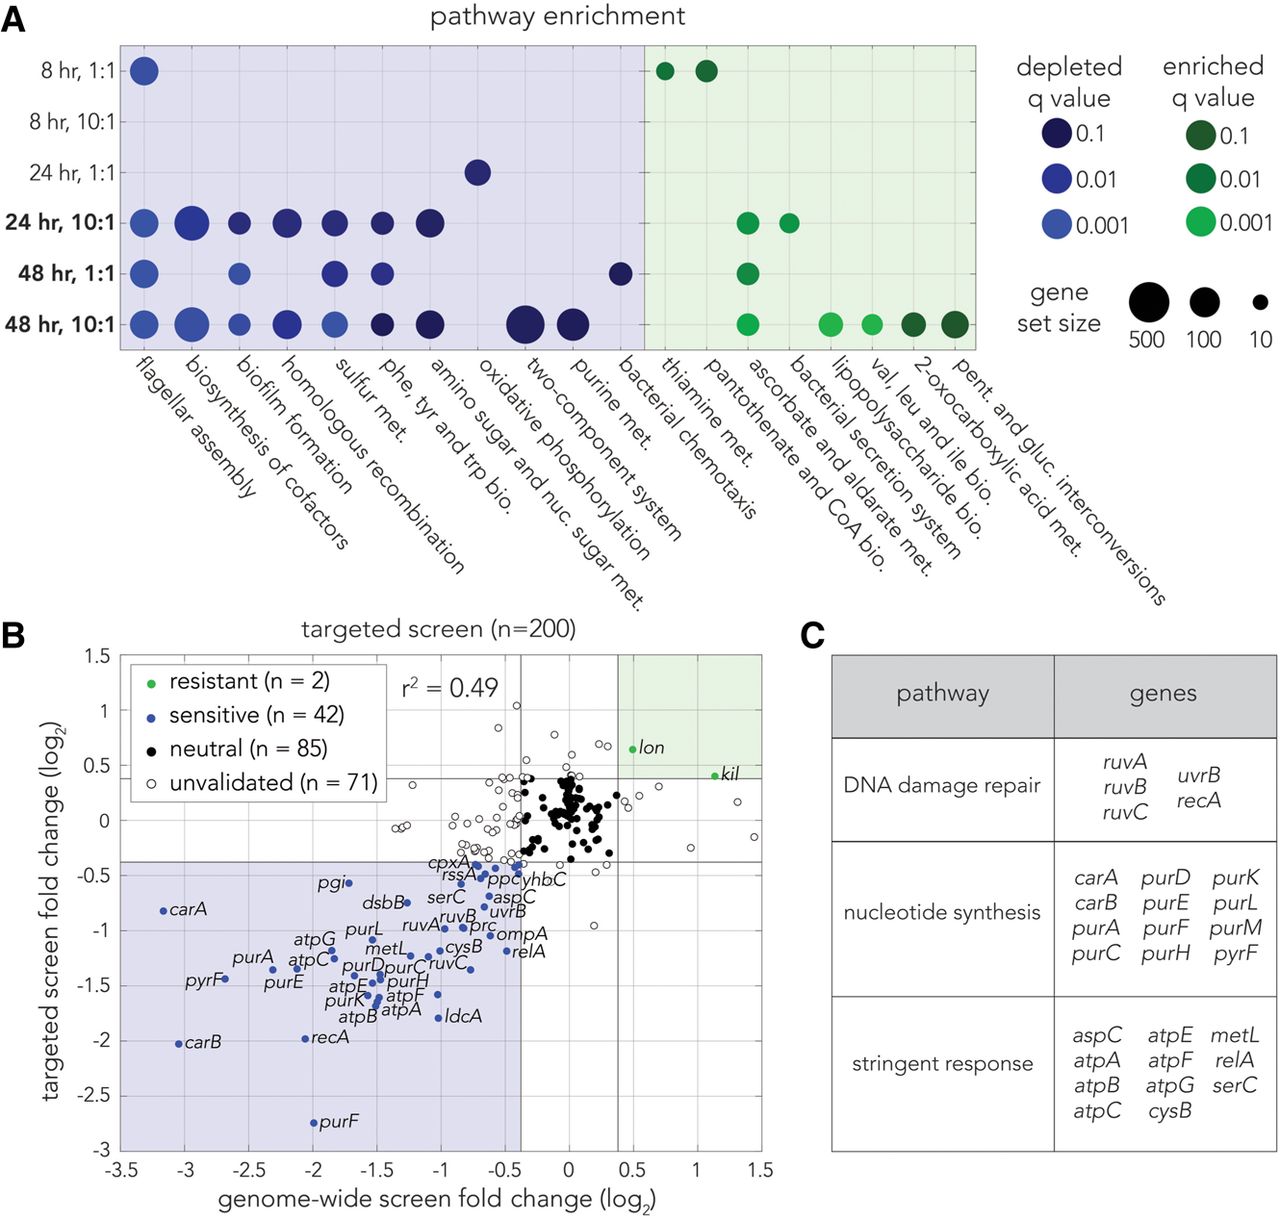
Pathway enrichment and targeted validation screen identify roles of homologous recombination in colibactin response. (A) Pathway enrichment analysis using KEGG (Kanehisa and Goto 2000) terms for each screen. Enriched terms are colored in green by Q-value, and depleted terms are colored in blue by Q-value. Circle size represents the size of the gene set for the respective pathway. (B) Comparison of knockout fold-changes in the genome-wide screen and targeted validation screen. Points are colored by consensus enrichment change in the genome-wide screen and targeted screen: green for resistant, blue for sensitive, black for neutral, and empty for unvalidated. Gray lines mark the fold-change cutoff (1.3). (C) Key pathways underlying colibactin sensitivity. Twenty-eight of the validated colibactin-sensitive knockouts are associated with three cellular pathways.