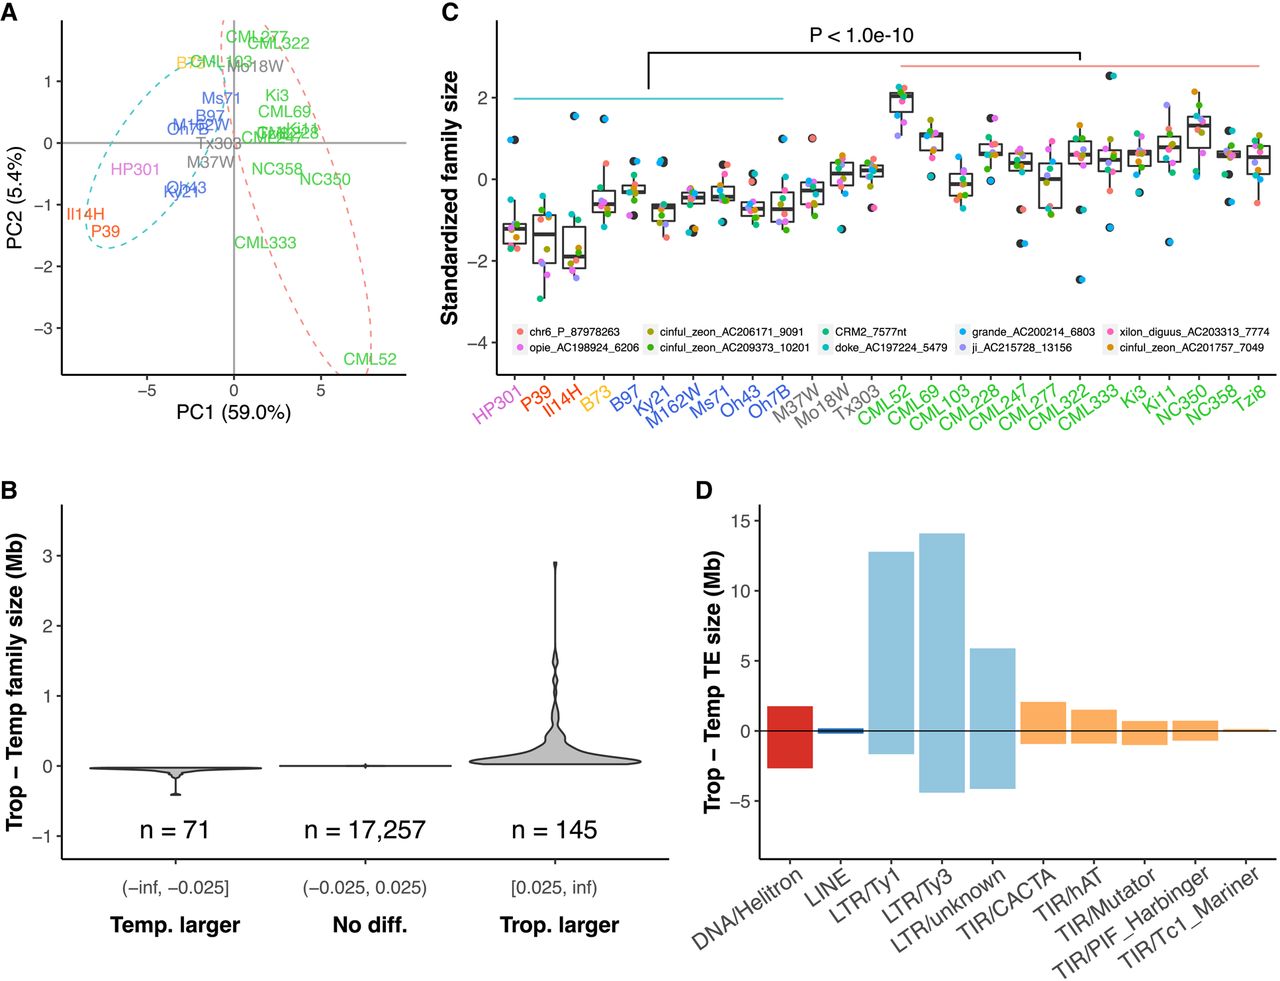
Family size variation between tropical and temperate maize genomes. (A) Principal component analysis based on pan-TE family size in the NAM founder genomes. A total of 17,473 families were included, and the size of the family was determined by the number of base pairs in each genome. Dashed ellipses indicate tropical (pink) and temperate (blue) genomes. (B) Distribution of TE family size difference between tropical and temperate lines. Families are divided into three categories with a cutoff of ±0.025 Mb difference. (C) Distribution of the top 10 TE families with the greatest size variation among the NAM founder genomes, which are all LTR families. The size of each family was standardized to have mean = 0 and standard deviation = 1 within NAM founder lines. Maize lines were grouped into temperate maize (popcorn, pink; sweet corn, red; stiff-stalk, yellow; non-stiff-stalk, dark blue) as indicated by the blue line on top of the boxes, admixed maize (gray), and tropical maize (green, as indicated by the pink line on top of the boxes). The box shows the median, upper, and lower quartiles. Whiskers indicate values ≤ 1.5× interquartile range. Black dots indicate outliers. (D) TE family size difference between tropical and temperate lines in TE superfamilies. Positive values represent families that are larger in tropical genomes, and negative values represent families that are larger in temperate genomes. (LTR/unknown) LTR families unable to be classified into Ty1/Ty3 superfamilies owing to lack of coding regions or confounding classifications.