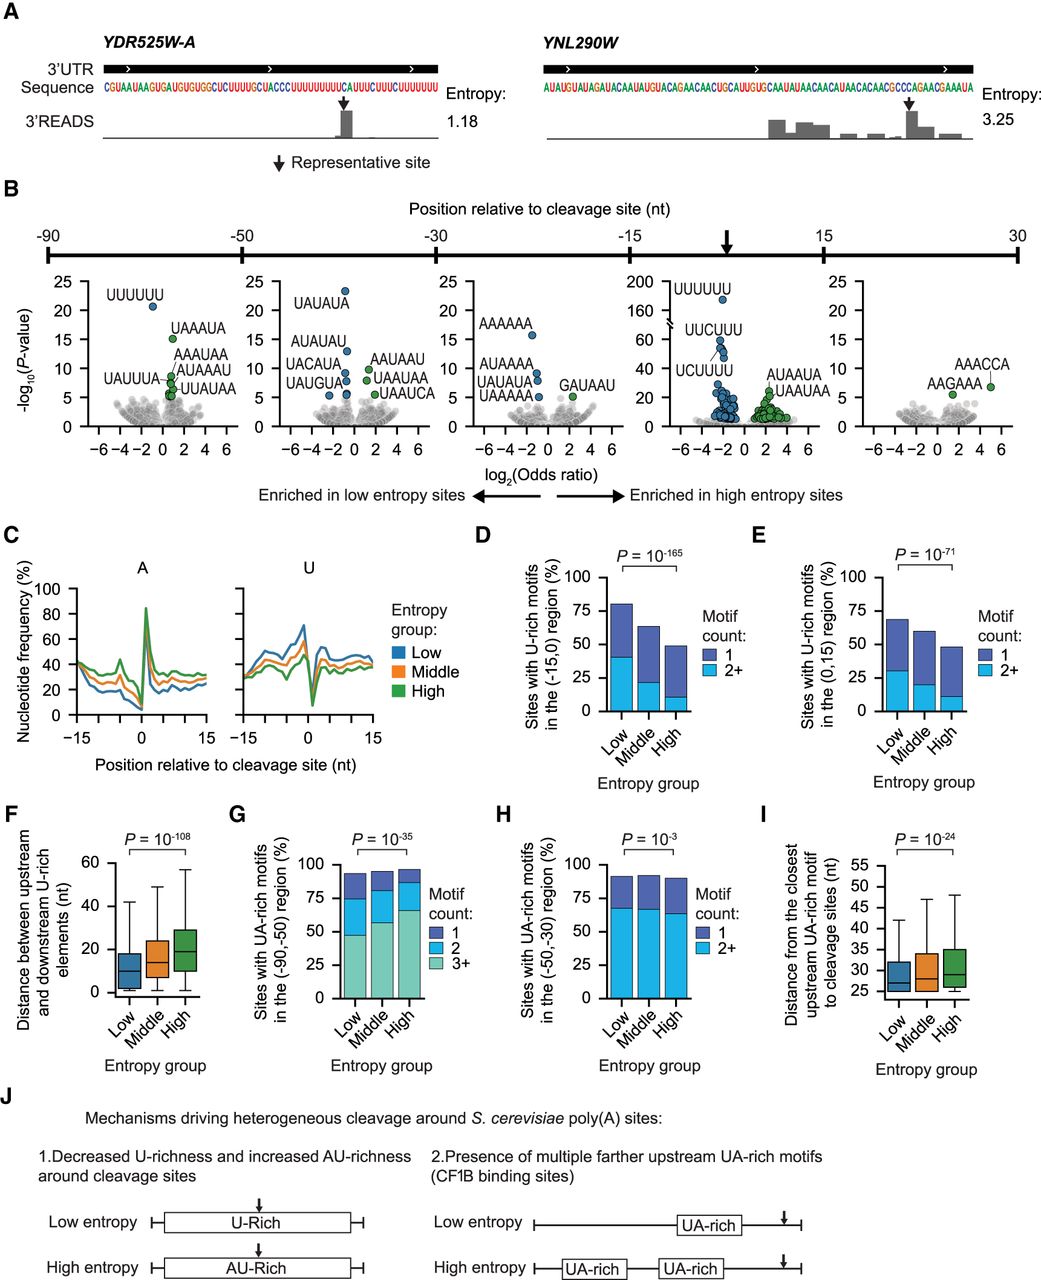
Poly(A) site heterogeneity is driven by cleavage site composition and upstream efficiency elements. (A) Examples of the PASS read distribution surrounding a low entropy site (left) and a high entropy site (right). The entropy values are shown. (B) Motif enrichment analysis comparing the low (bottom 20%) versus high (top 20%) entropy poly(A) site groups. Five different poly(A) site regions were analyzed as indicated in the figure. The x-axis indicates the degree of enrichment as measured by log2(odds ratio). Positive values indicate enrichment in the high entropy sites, and negative values indicate enrichment in the low entropy sites. The y-axis shows the −log10(chi-squared test P-value) for the motifs enriched in the high entropy group and log10(chi-squared test P-value) for ones enriched in the low entropy sites. (C) The nucleotide distribution flanking the maximum cleavage sites showing the fraction of As (left) and Us (right). (D) The fraction of sites in each entropy group containing one or more U-rich motifs in the [–15,0] region immediately upstream of the maximum cleavage site. U-rich motifs with up to 2 nt mismatches from UUUUUU were included. The P-value from the chi-squared test for independence across entropy groups is shown. (E) Similar to D, except showing the analyses in the [0,15] region immediately downstream from the maximum cleavage site. (F) Box plots showing the distance between the closest upstream and downstream flanking U-rich elements. The P-value is the result of a Wilcoxon rank-sum test comparing the low versus high group. (G) The fraction of sites in each entropy group containing one or more UA-rich motifs in the [–90,–50] region upstream of the maximum cleavage site. UA-rich motifs with up to 2 nt mismatches from AUAUAU or UAUAUA were included. The P-value from the chi-squared test for independence across entropy groups is shown. (H) Similar to G, except showing the fraction of sites with UA-rich motifs in the [–50,–30] region upstream of the maximum cleavage site. (I) Box plots showing the distance from the closest UA-rich motif in the [–90,–30] region to the cleavage site. (J) Schematic depicting the mechanisms identified from this analysis that may lead to heterogeneous cleavage in S. cerevisiae.