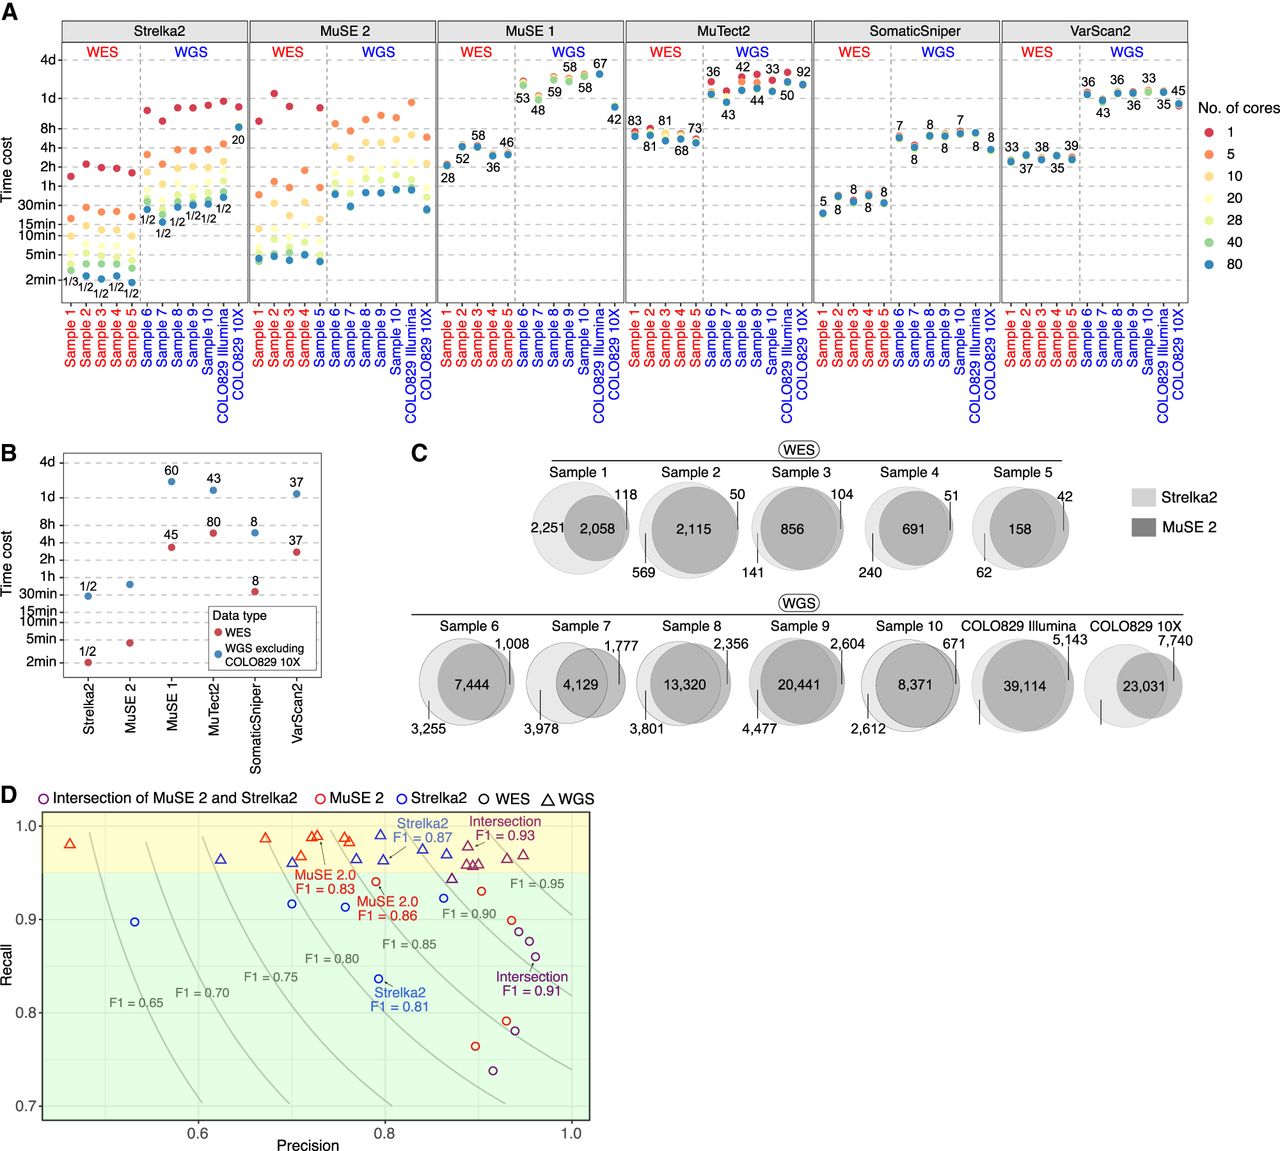
Benchmarking the speed and usability of MuSE 2. (A) The runtime of MuSE 2 against MuSE 1 and the other four methods for both the WES and WGS data across different numbers of cores. The numbers in the plot represent the fold speedup of MuSE 2 (with 80 cores) relative to the other methods whose time cost is averaged across different numbers of cores (excluding core = 1). For Strelka2, only the time cost with 80 cores is considered. (B) A simplified version of A in which the time cost of each method is averaged across all samples (excluding COLO829 10X as an outlier; see A) and different numbers of cores. (C) Venn diagrams showing the unique and shared SNV calls of MuSE 2 and Strelka2. (D) Scatter plot of the precision and recall for the intersection calls from MuSE 2 (in red) and Strelka2 (in blue) and the calls from each of the two methods (in purple) against the previously reported consensus calls, which are considered as the benchmark. For both the WES (circle) and WGS (triangle) data, the median F1 scores of the intersection calls and calls of each individual method are shown. Two shaded rectangles highlight the difference of the performance metrics between the WES and WGS data. Results from the WGS data are located in the top rectangle.