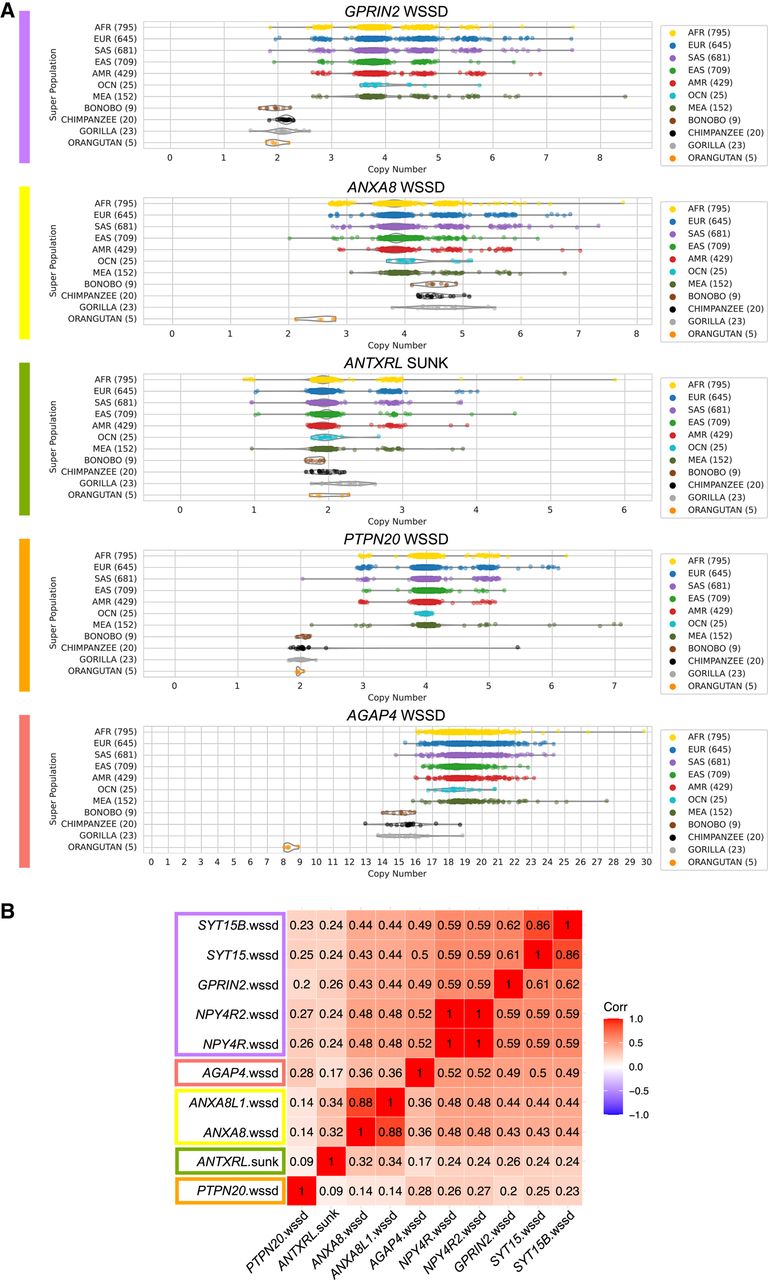
Figure 2.
Copy number of 10q11.22 genes. (A) WSSD or SUNK estimates of GPRIN2, ANXA8, ANTXRL, PTPN20, and AGAP4 copy number in 1KGP, HGDP, and nonhuman primate panels. The color of the line to the left of each plot corresponds to the color code of the segment where the gene is located (see Fig. 1A). (B) Spearman's correlations between copy number estimates of NPY4R/R2, GPRIN2, SYT15/15B, AGAP4, ANXA8L1, ANXA8, ANTXRL, and PTPN20. All values are significant. The color of rectangles around gene symbols corresponds to the color code of the segment where the genes are located (see Fig. 1A).