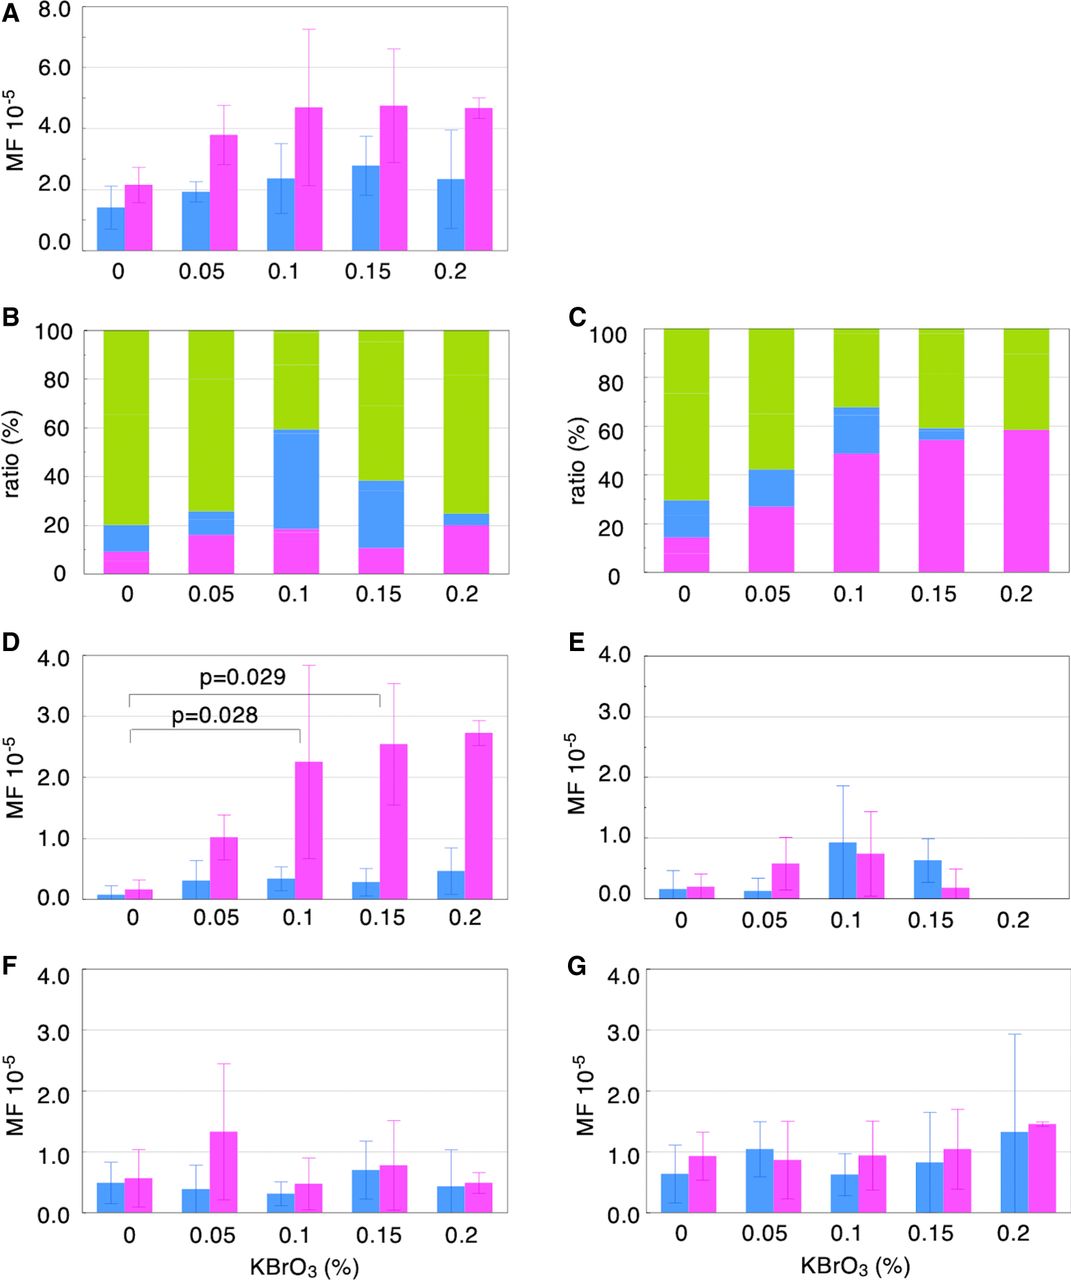
Somatic mutations in the normal intestinal tissues detected using the rpsL assay. (A) Mutation frequency (MF) in Mutyh−/− mice (magenta) and Mutyh+/+ mice (blue) based on the KBrO3 dose. Mean ± SD. (B) The relative ratio of mutation type is shown in the stacked bar chart. Mutations in the Mutyh+/+ mice. Green, magenta, and blue indicate indels, transversions, and transitions, respectively. (C) Same chart as B for Mutyh−/− mice. (D–G) MF is plotted based on the mutation type. Mean ± SD. Mutyh−/− mice (magenta) and Mutyh+/+ mice (blue). Steel's test (vs. KBrO3 0%; control) was performed, and P-values are described in the plot if significant. (D) G:C > T:A transversion. (E) G:C > A:T transition. (F) One-base-pair deletion. (G) More than 2-bp indel.