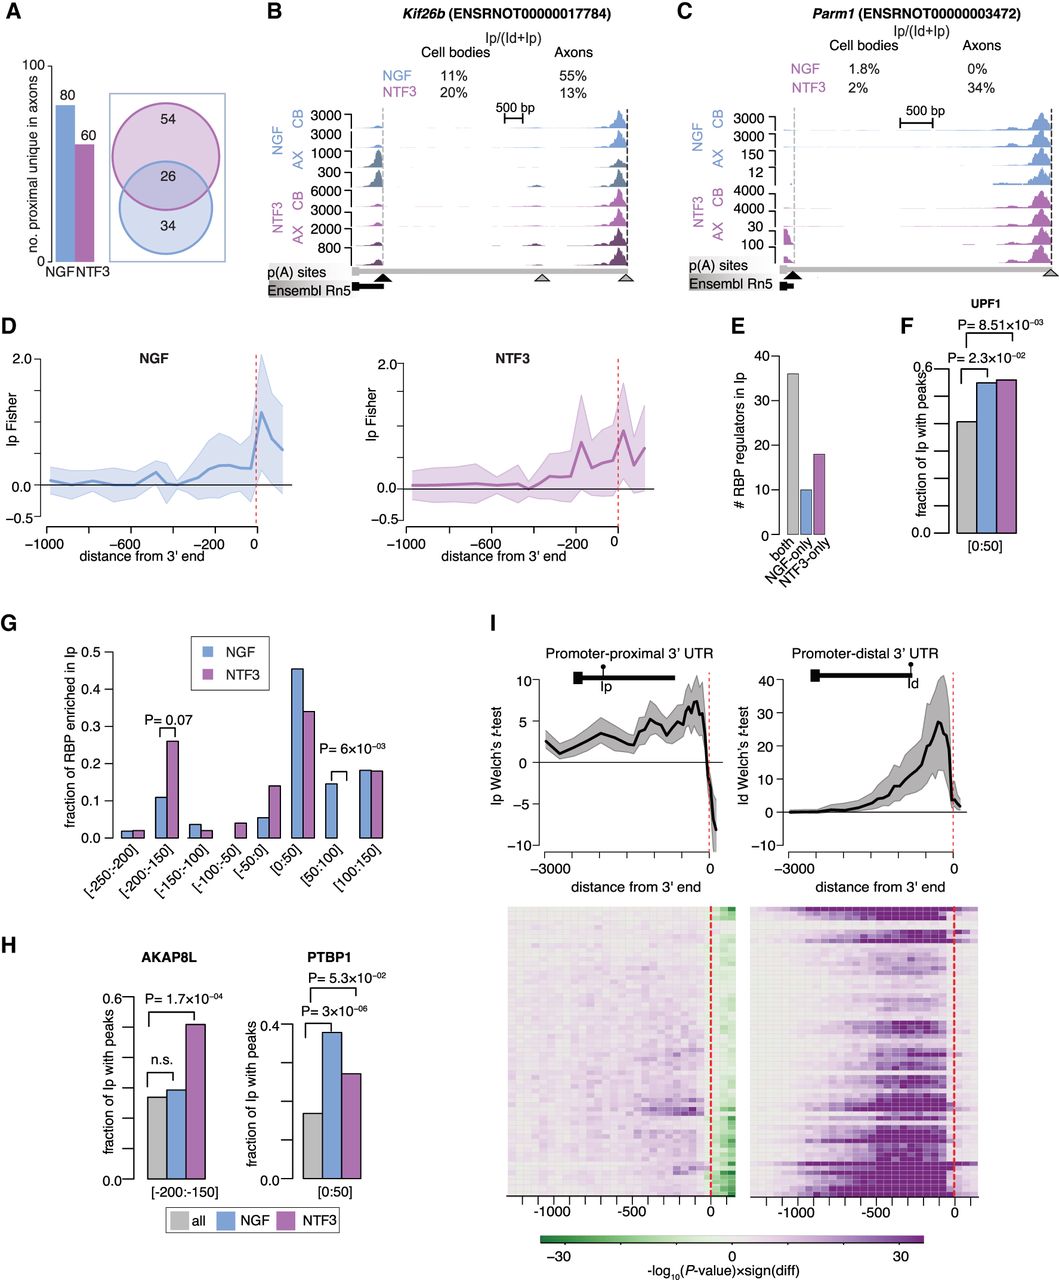
Negative regulators of APA in the cell body are candidate 3′ UTR cleavage factors in the axons. (A, left) Number of 3′ UTR isoforms with proximal shift uniquely detected in axons in NGF (blue) and NTF3 (purple) culture condition. (Right) Venn diagram showing the overlap between the candidate of axonal remodeling in NGF and NTF3. (B,C) Representative transcripts with a marked shift toward axonal increase in promoter-proximal 3′ UTR uniquely detected either in axons treated with NGF (Kif26b; B) or in axons treated with NTF3 (Parm1; C). (D) Distribution of the extent of significant enrichment in 126 RBP cross-link events in defined regions along the 3′ UTR of the 80 (left) and 60 (right) candidate isoforms of axonal remodeling in NGF and NTF3 condition, respectively. Dark lines display the median significance; shaded areas, lower and upper quartiles. (E) Number of candidate RBPs regulators of axonal remodeling identified in the [−250:+150]-nt region surrounding the 3′ end of the promoter-proximal isoform in both conditions, in NGF only and NTF3 only (gray, blue, and purple bars, respectively). (F) Fraction of promoter-proximal 3′ UTR isoforms showing cross-link events for UPF1 in the [0:50]-nt region downstream from the cleavage site. Gray bar indicates all promoter-proximal 3′ UTR; blue bars, 80 candidates of axonal remodeling in NGF; and purple bars, 60 candidates of axonal remodeling in NTF3. (G) Fraction of candidate RBPs regulators of axonal remodeling in NGF and NTF3 at specific positions along the 3′ UTR where they show the most significant enrichment. Fisher's enrichment test. (H) Same as G for AKAP8L and PTBP1. (I, top) Distribution of the extent of significant positive or negative association between the cross-link events in defined regions along the short (left) and long (right) 3′ UTR isoforms of 65 candidate regulators for axonal remodeling, as well as their relative usage of the short and the long isoform in the cell body. Dark lines display the median significance; shaded areas, lower and upper quartiles. (Bottom) Heatmaps showing the individual significance association between cross-link events of individual RBPs along the short (left) or long (right) 3′ UTR isoform and their relative usage in the axons.