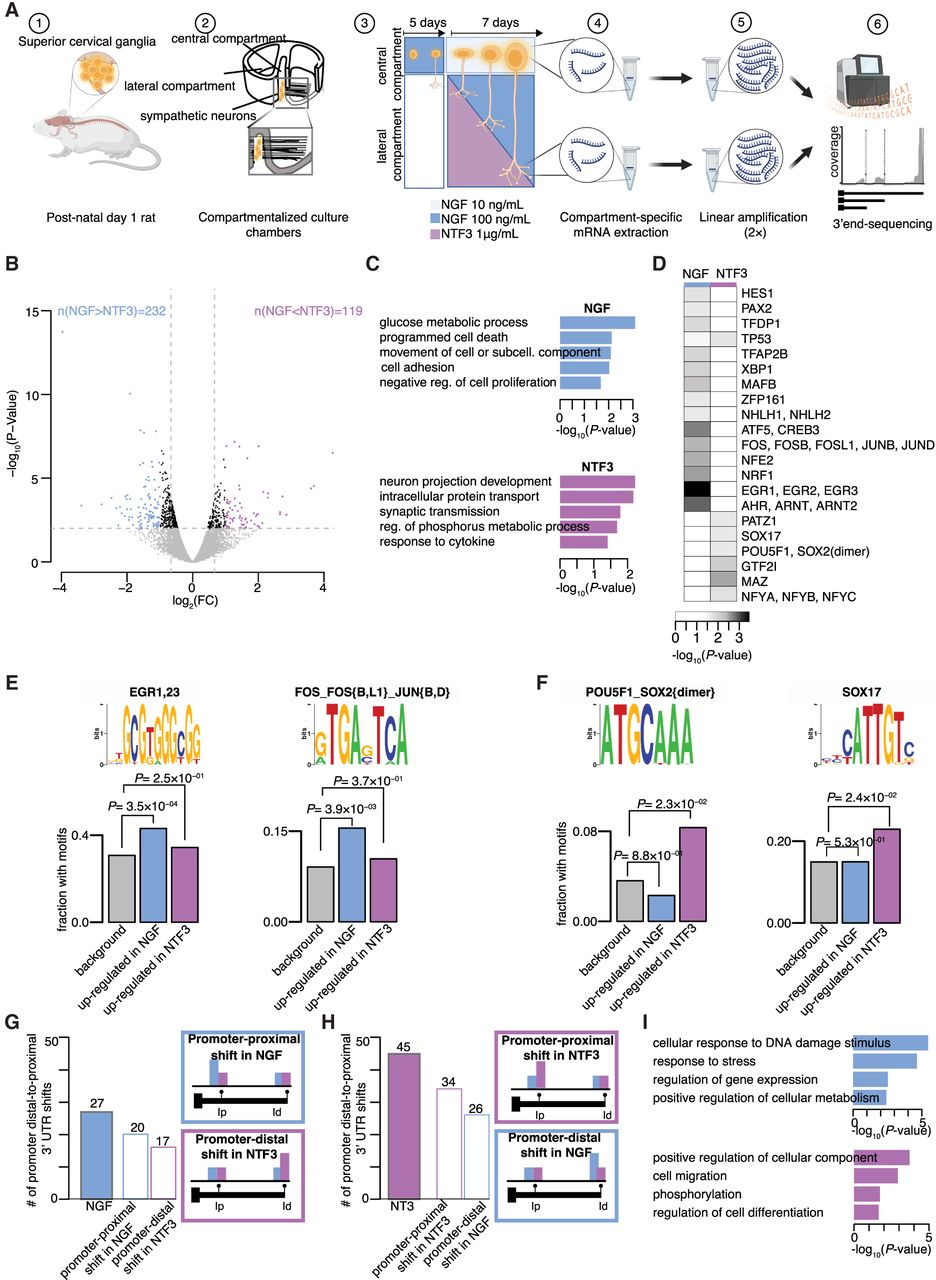
NGF and NTF3 are equally capable of regulating transcriptional changes when applied to distal axons. (A) Schematic of the experimental set-up. (B) Volcano plot representing log2 fold-change (log2FC) in gene expression values between neurons whose axons were exposed to NGF or NTF3, as well as corresponding P-values (−log10). Blue dots indicate genes significantly up-regulated in NGF; purple dots, genes significantly up-regulated in NTF3 (FC > 1.5 and P-value < 0.01). (C) Enrichment scores of GO biological pathways associated with up-regulated genes in NGF-treated (top) and NTF3-treated (bottom) neurons. (D) Fisher's enrichments in predicted binding sites motifs for 21 transcription factors in the 1000-nucleotide (nt) promoter region of the up-regulated genes in NGF- or NTF3-treated neurons. (E,F) Sequence logos of predicted motifs bound by transcription factors (top) and fractions of promoter regions with these motifs (bottom) in the total pool of expressed genes (gray bar), the genes up-regulated in NGF (blue bar), and the genes up-regulated in NTF3 (purple bar). Fisher's enrichment test. (G, left) Number of transcripts showing significant promoter distal-to-proximal shifts in NGF compared with NTF3 (filled-in bar) alongside their composition in terms of proximal shift in NGF versus distal shift in NTF3 (outlined bars). (Right) Legend of the color outline schematizing the relative usage of the promoter-proximal (Ip) and promoter-distal (Id) 3′ UTR isoforms underlying differential 3′ UTR isoform usage between NGF and NTF3. (H) Same as G for changes in NTF3 compared with NGF. (I) Enrichment scores of GO biological pathways associated with significant increase in distal-to-proximal promoter 3′ UTR usage in NGF compared with NTF3 (top) and vice versa (bottom).