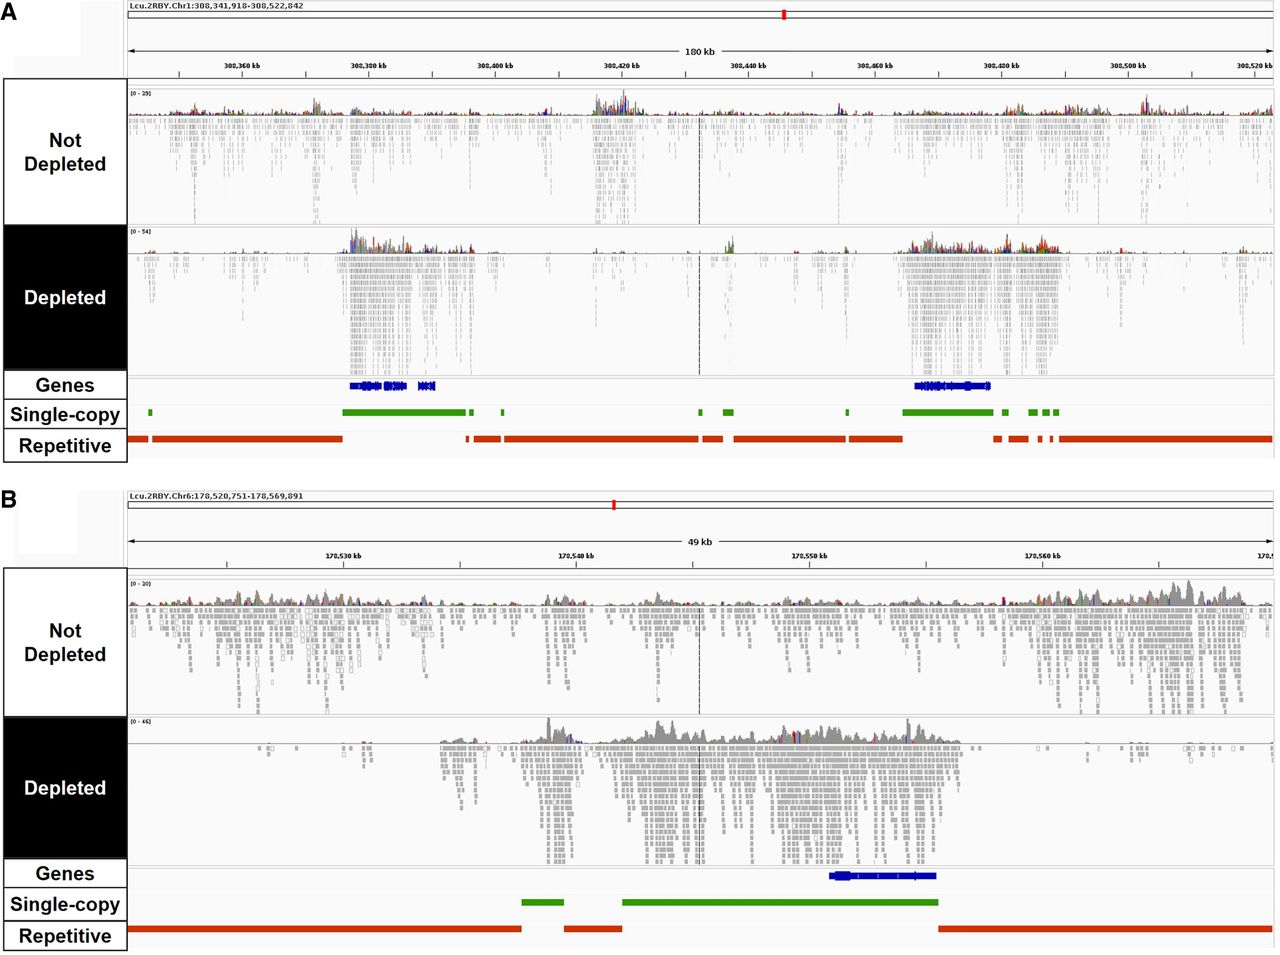
Figure 2.
Reads mapped to repetitive or single-copy regions of the lentil genome with or without CRISPR-Cas9-mediated repeat depletion. Integrative Genome Browser Visualization (IGV) (Thorvaldsdóttir et al. 2013) of Illumina sequencing data mapped to two representative genomic sites of ∼180 kbp (A) and ∼50 kbp (B). Tracks in blue, green, and red represent annotated genes, single-copy regions, and repetitive regions, respectively.