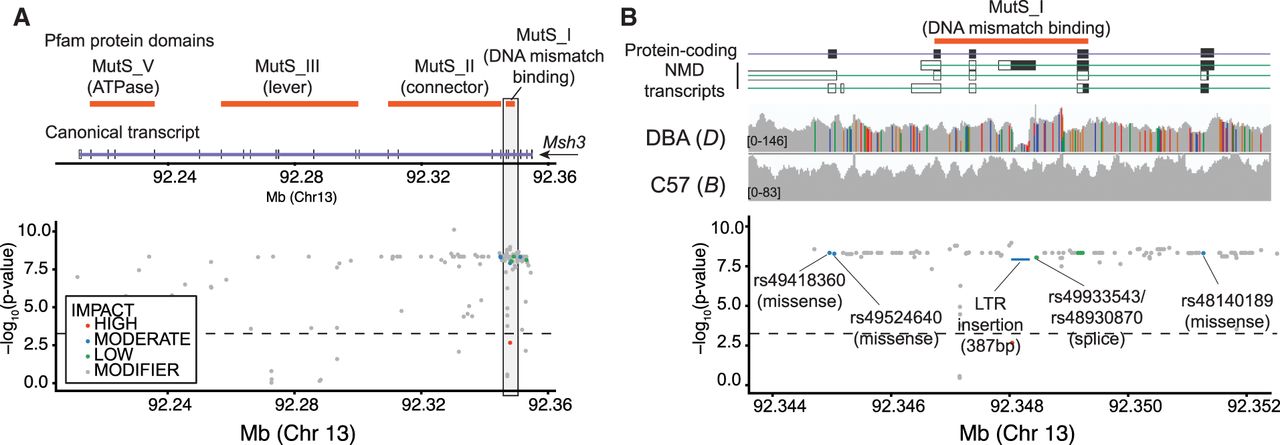
Variants predicted to impact Msh3. (A) Summary of variants overlapping Msh3. The top panel shows the canonical protein-coding transcript of Msh3 (purple) and protein domains (orange rectangles) obtained from Pfam (Mistry et al. 2021). The bottom panel shows the location (mm10; x-axis) of variants and their association with the expansion propensity phenotype (–log10 P-values; y-axis). Variants are colored by their impact predicted by VEP: red indicates high; blue, moderate; green, low; gray, modifier). (B) Summary of variants in the variant-dense 5′ region of Msh3. Top and bottom panels are the same as in A. The middle panel shows a histogram of read coverage as visualized using the Integrative Genomics Viewer (Robinson et al. 2011). Colored bars denote the fraction of reads at each position with mismatches from the reference, which is based on C57BL/6J. Gray denotes matches to the reference. In both panels, rare variants are excluded (non-major-allele fraction < 0.15). The –log10(P-value) threshold distinguishes variants associated with the expansion propensity phenotype (model P-value ≤ 5 × 10⁻⁴).