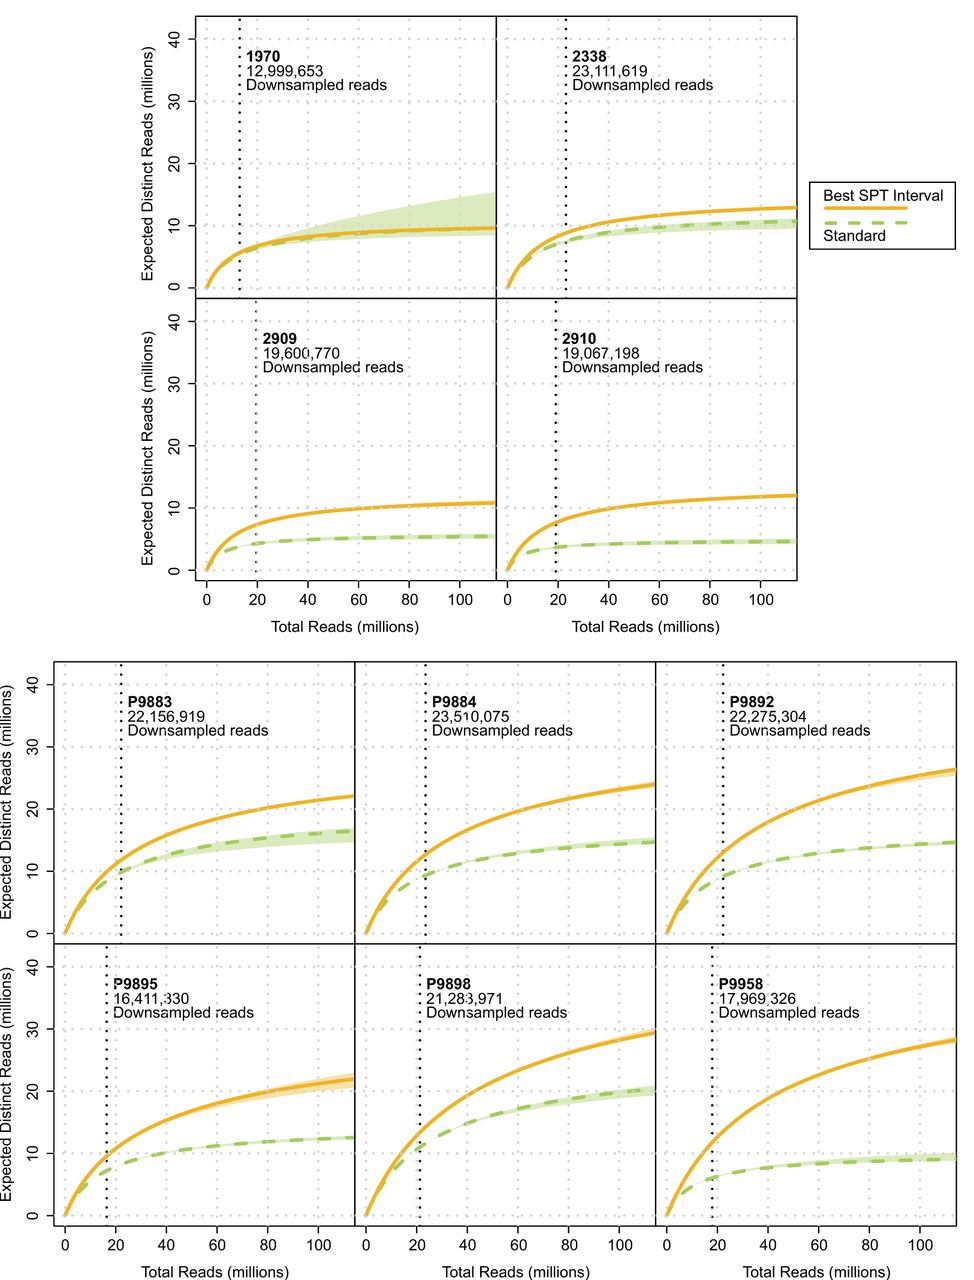
Figure 5.
Yield of expected distinct reads for a theoretically larger sequencing effort, as a measure of library complexity, using the lc_extrap function of the software preseq. Vertical dotted lines represent the number of reads to which each sample's best SPT interval and standard extraction was randomly down-sampled. Shaded areas represent 95% confidence intervals. Results shown here for up to 100 million total reads; in Supplemental Figure S3, for up to 500 million.