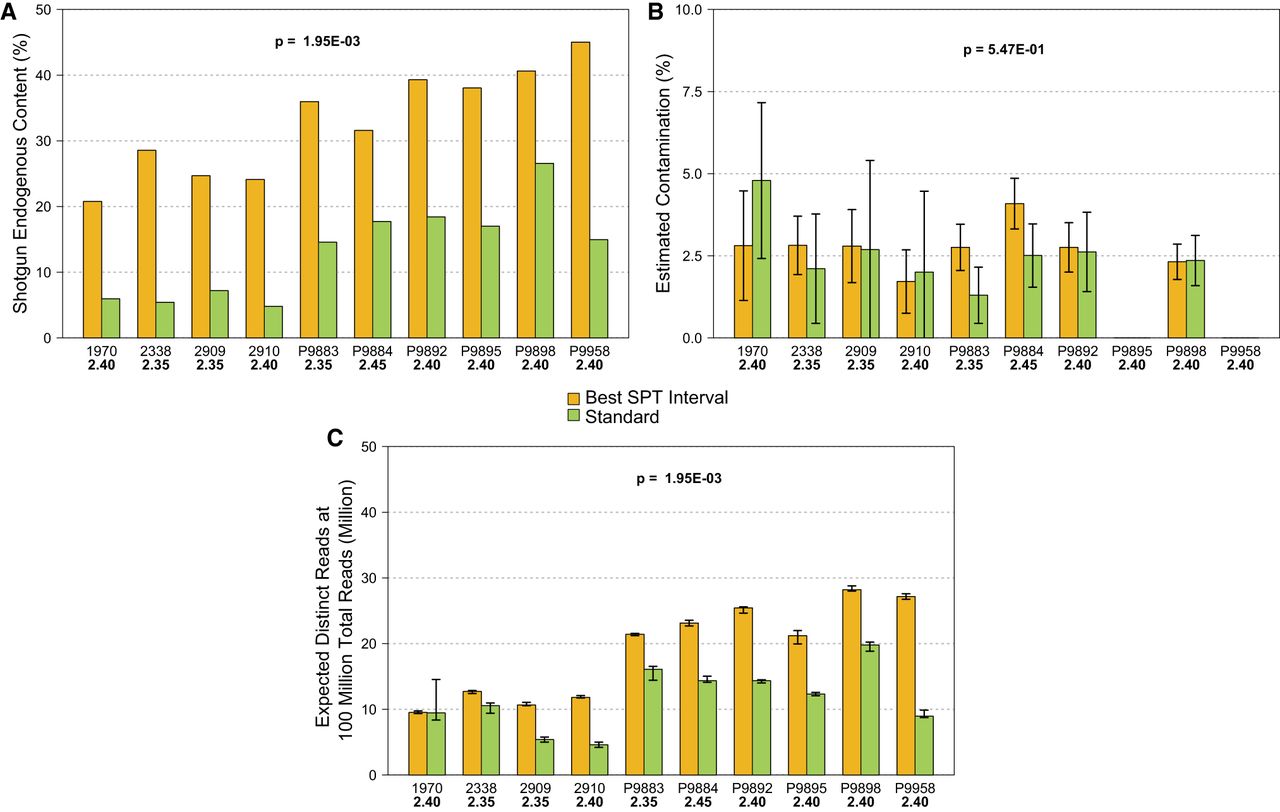
Figure 3.
Comparison of some quality and authenticity metrics between the best SPT interval and the same individual's standard extraction. (A) Endogenous DNA contents (P-value = 0.001953). (B) Contamination estimated by hapCon for male individuals (P-value = 0.5469). (C) Expected distinct reads after deep sequencing as a measure of library complexity, estimated by preseq at a total number of reads of 100 million (P-value = 0.001953). P-values shown in bold denote significance under a threshold of 0.05. Panels A and B use subsampled and normalized total read numbers (Supplemental Table S2), whereas panel C uses the full merged data for statistical power (Supplemental Table S1).