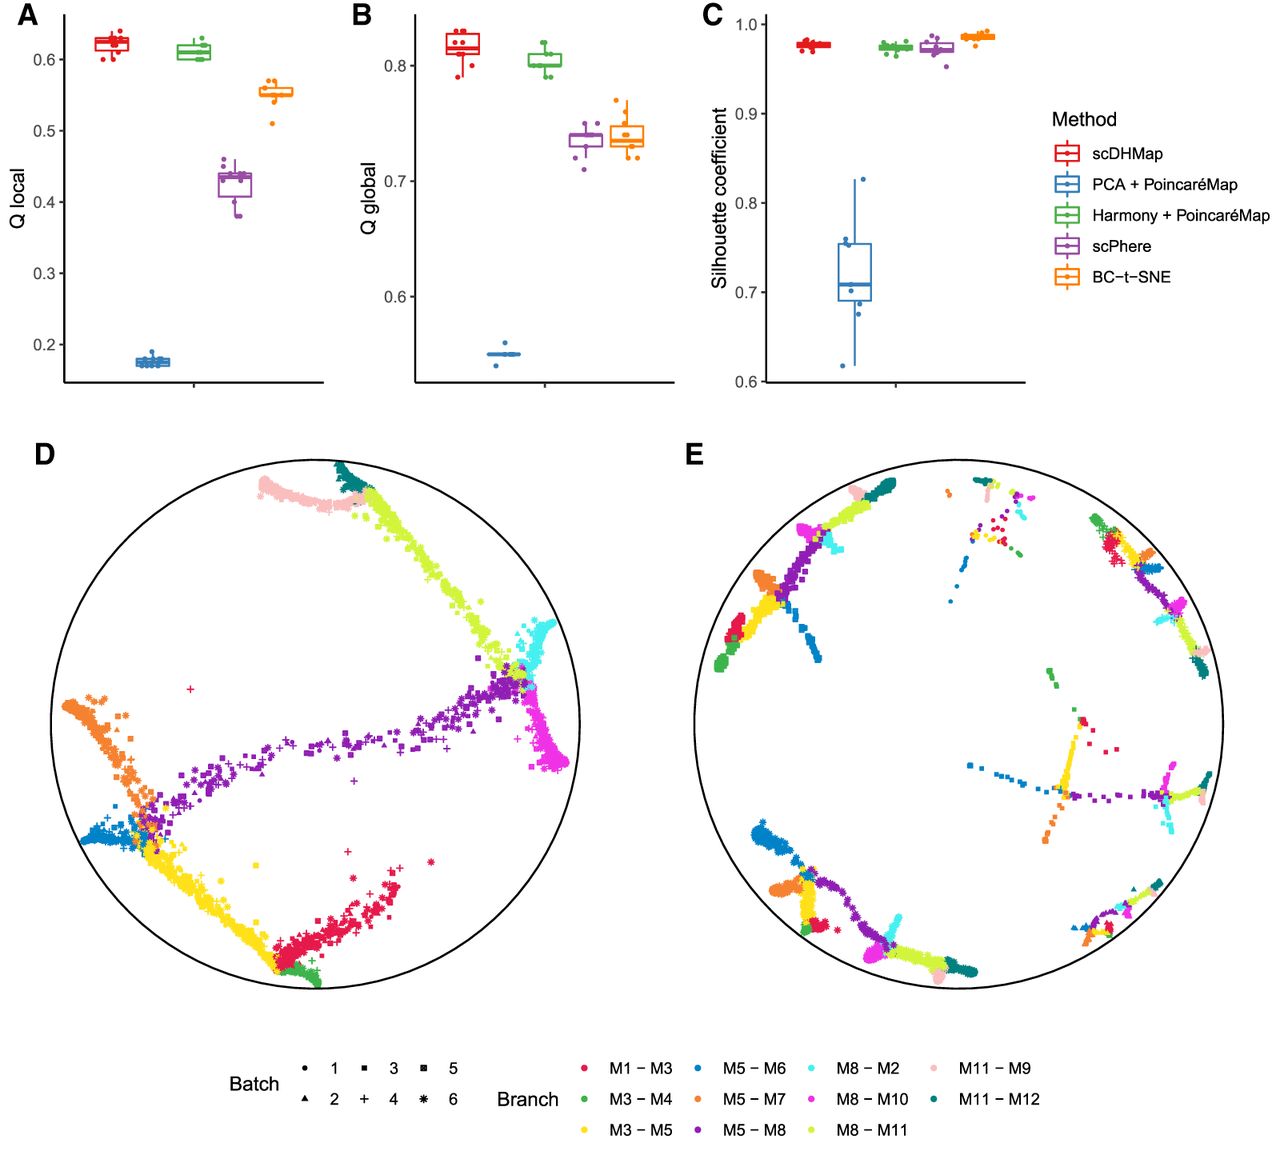
Figure 3.
Evaluation of embeddings for batch alignment. (A,B) Embedding quality metrics of methods on simulated data sets with six batches. Ten data sets had been generated. (C) Silhouette coefficient (SIL) for quantifying the batch alignments. Larger values mean better alignments. (D) Embedding of scDHMap. (E) Embedding of PCA + PoincaréMap. Colors represent branches, and dot shapes represent batches (D,E).