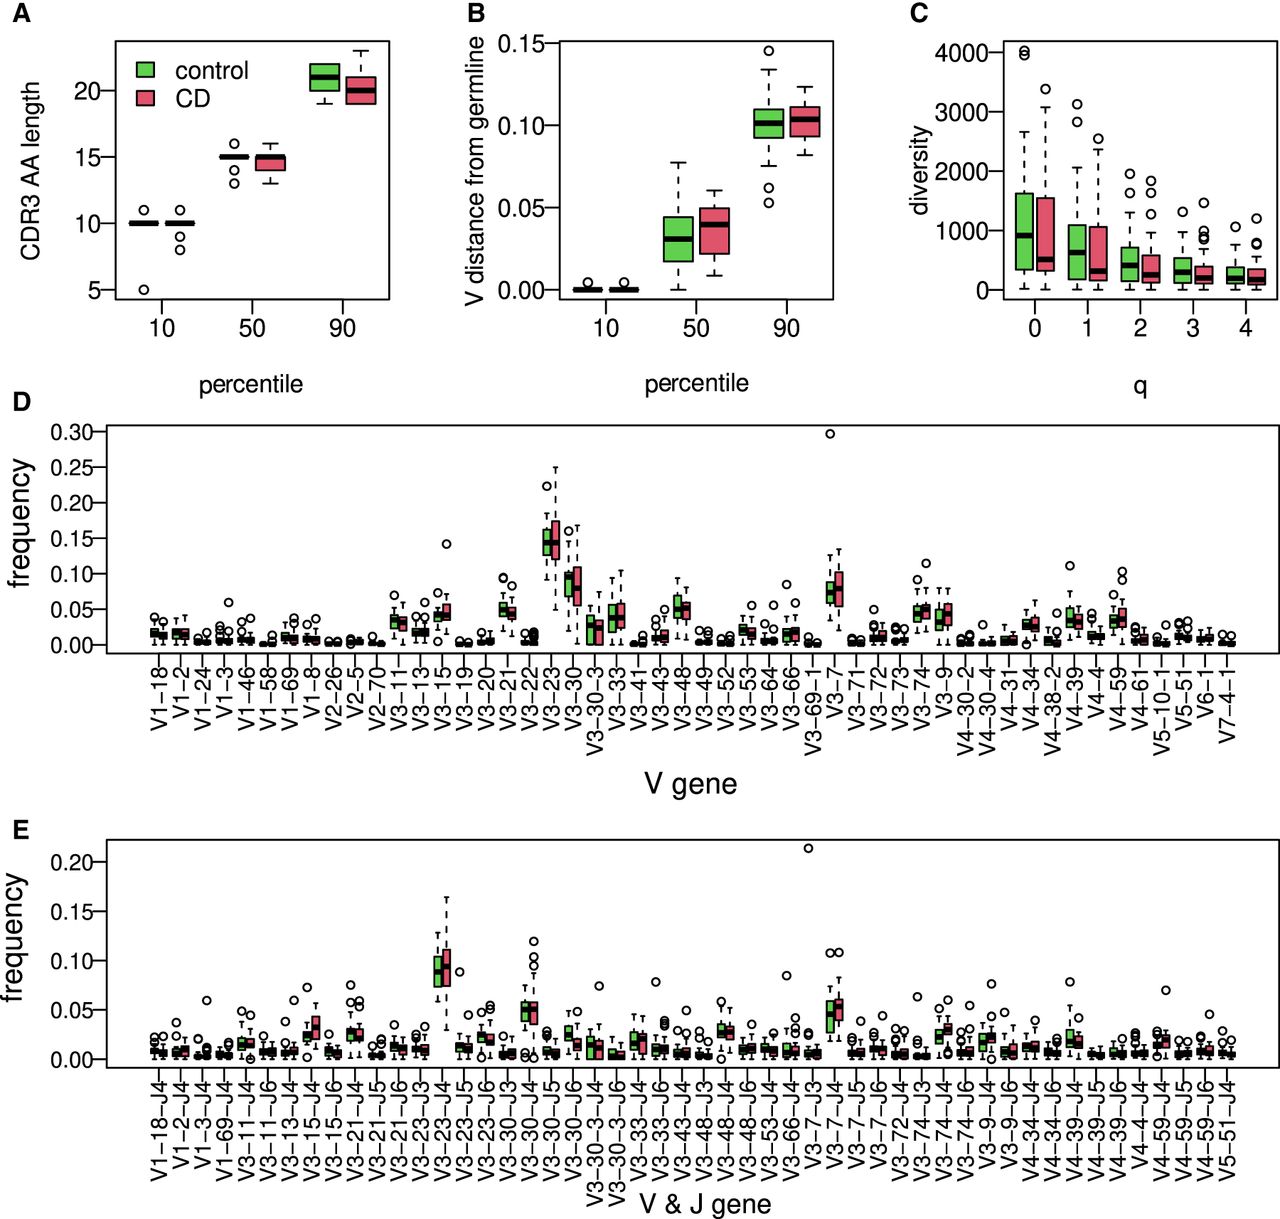
Figure 2.
Characterization of ileal immune BCR repertoire features. (A) The 10, 50, and 90 percentiles of AA CDR3 length in individuals with CD compared with the controls. (B) The 10, 50, and 90 percentiles of V gene distances from germline in individuals with CD compared with the controls. (C) Boxplot showing calculated Hill diversity indexes upon different q-values between individuals with CD and the controls. (D) Boxplots showing V gene usage in individuals with CD and the controls; shown are the top 50 mean frequencies. (E) VJ gene usage comparison between individuals with CD and healthy ones; shown are the top 50 frequencies.