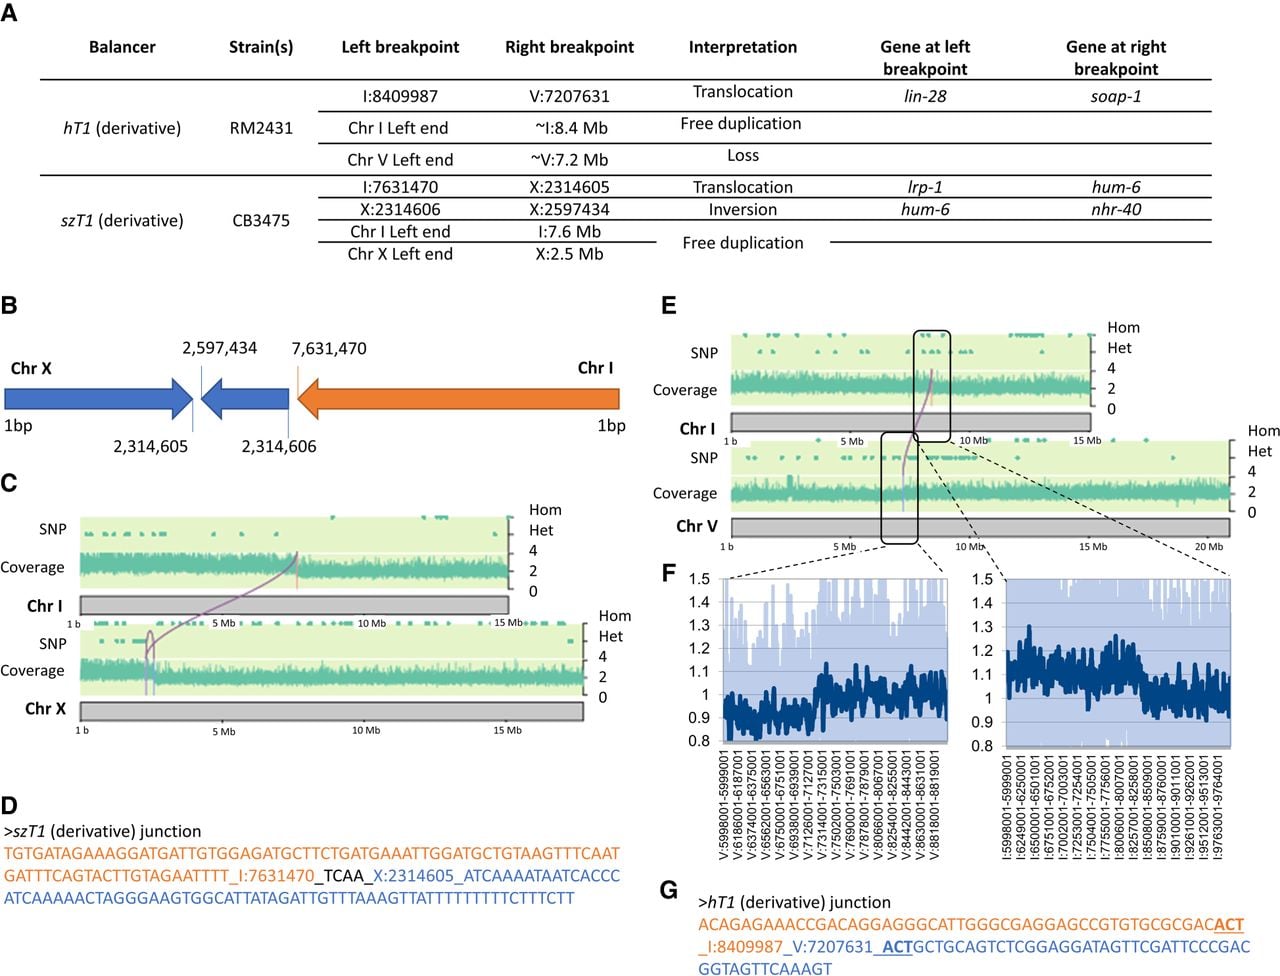
Overview of potential derivative balancers. (A) Breakpoints of hT1 and szT1 derivatives. If the breakpoints are localized in a gene and disrupting it, we report such gene (“gene at left breakpoint” for a left breakpoint mapping in a gene and “gene at right breakpoint” for a right breakpoint mapping in a gene). (B–D) szT1 derivative. (B) Interpretation of the structure of szT1 derivative in CB3475 based on srWGS analyses. (C) In the graph of the upper layer, SNVs detected in the CB3475 genome are denoted by dots. Dots on the higher layer are homozygous SNVs with two copies of the alternate allele. Dots on the middle layer are heterozygous SNVs with only one copy of the alternate allele. Stretches of heterozygous SNVs suggest that the region is balanced by a complex rearrangement. The coverage graph is a scatter plot representing the read coverage of the genome along the chromosome, calculated by window of 1 kb. The graph shows an increase in read coverage of left parts of Chr I and X. The purple lines represent the breakpoints detected. (D) Sequence at the junction of the breakpoint (I;X) obtained by Sanger sequencing. (E,F) hT1 derivative. (E) In the graph of the upper layer, SNVs detected in the RM2431 genome are denoted by dots. Dots on the higher layer are homozygous SNVs with two copies of the alternate allele. Dots on the middle layer are heterozygous SNVs with only one copy of the alternate allele. Stretches of heterozygous SNVs suggest that the region is balanced by a complex rearrangement. The coverage graph is a scatter plot representing the read coverage of the genome along the chromosome, calculated by window of 1 kb. The graph shows an increase in read coverage of left parts of Chr I and X. The purple lines represent the breakpoints detected. (F) Scatter plots focused on the regions where the ratio of coverage changes on Chr I and Chr V. The normalized coverage along the rearrangement calculated by windows of 1 kb. The darker line represents the moving average (trend line, calculated over 20 points). (G) Sequence at the junction of the breakpoint (I;V) obtained by Sanger sequencing.