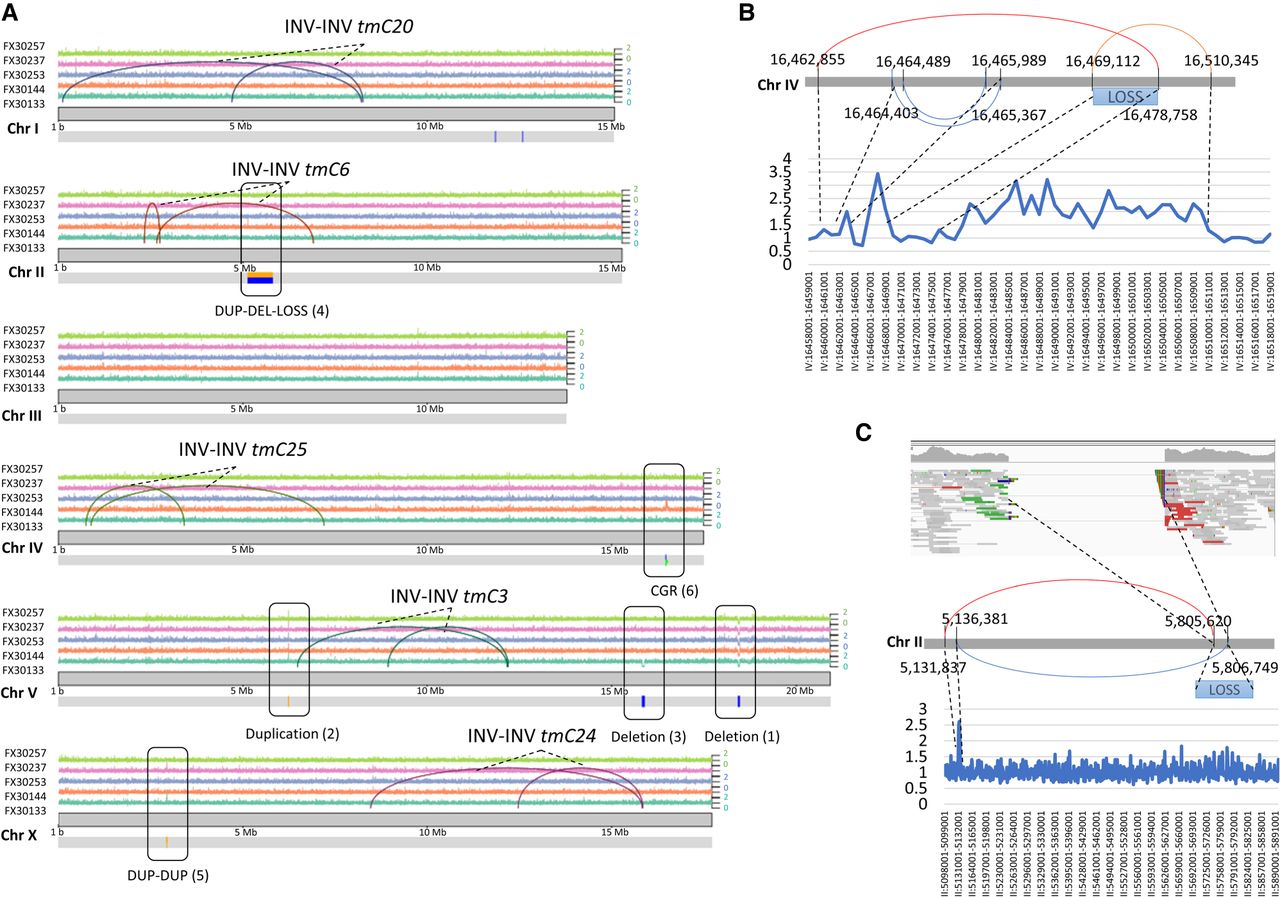
Overview of variants in CRISPR-Cas9 balancers. (A) Map of the CRISPR-ed double inversions and additional rearrangements detected. The upper tracks represent the normalized coverage for each strain. The lower track shows the position of structural rearrangements detected. The color code is green for FX30257, pink for FX30237, blue for FX30235, orange for FX30144, and blue-green for FX30133. The additional events 1–6 are detailed in Table 1. (B,C) Complex genomic rearrangements (CGRs) on Chr IV and Chr II detected in FX30144. Red link represents a copy gain. The graph on the top is a linear schematic representation of the breakpoints and junctions. Blue links represent a loss of copy. Orange link represents a gain of copy with inversion (possible inverted tandem duplication). In addition, we observed loss of copies (LOSS) by visualizing alignments using the Integrative Genomics Viewer (IGV) tool. The LOSS manifested by a complete absence of coverage (no read aligned on that segment of chromosome) but was not supported by split reads. It is possible that the loss of those regions is a consequence of the rearrangement, not a primary event. The scatter plots are a representation of the normalized coverage along the rearrangement calculated by windows of 1 kb. Both scatter plots were adapted to the size of the CGR. In C, the screenshot on the top shows how the reads aligned along the genome (IGV screenshot).