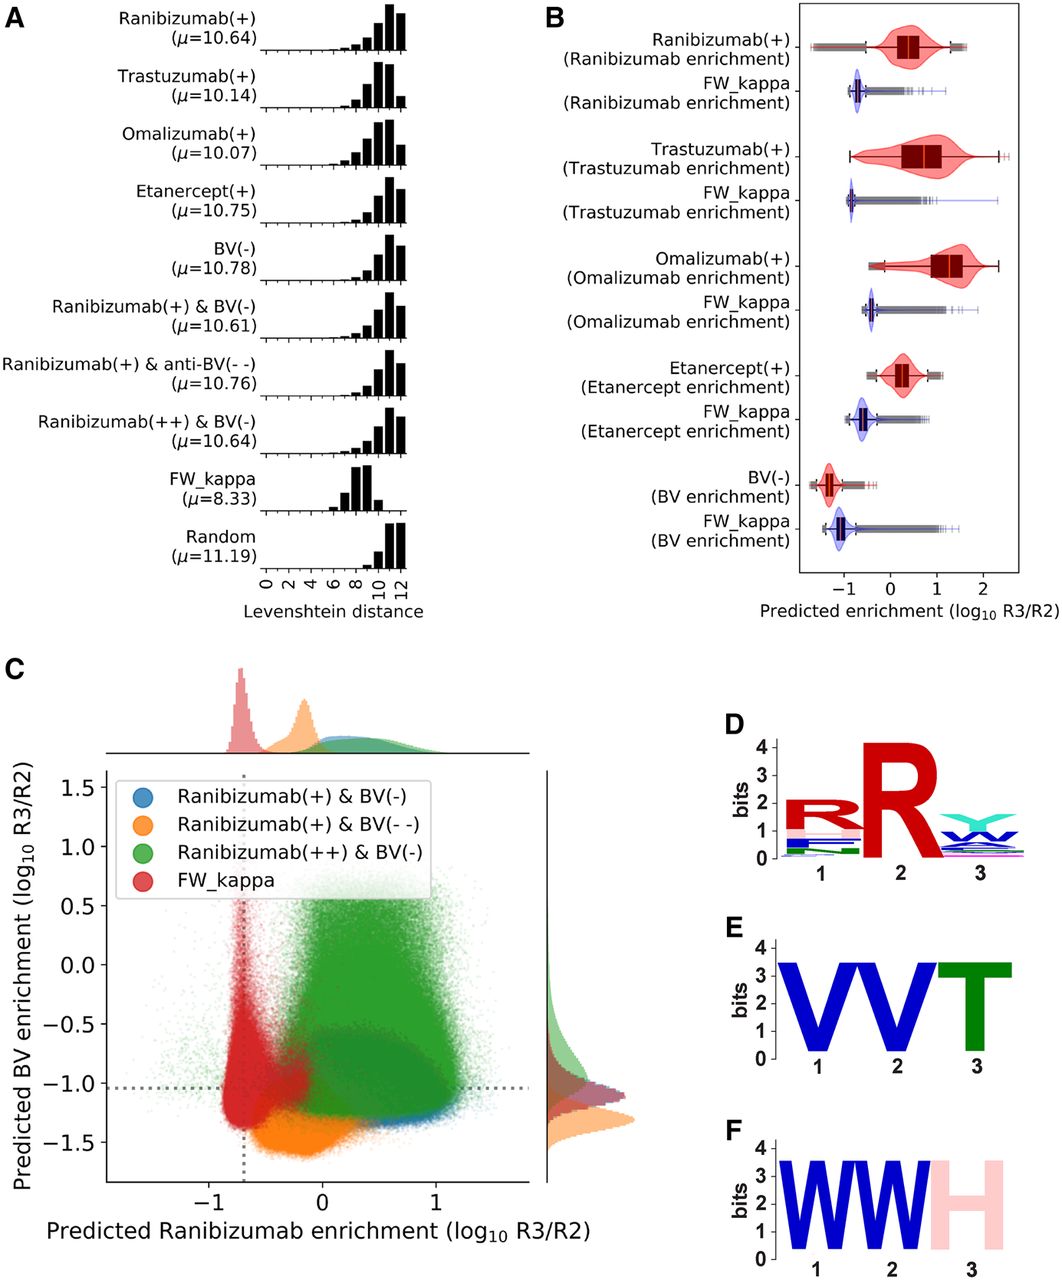
Factorizable library optimization and evaluation. (A) Histograms of the pairwise Levenshtein distance between pairs of length 12 sequences in each library and a uniformly random library. The mean distance, μ, is reported. (B) The sequence optimality (efficiency) of generated libraries compared with that of FW_kappa by scoring the sequences of FW_kappa and 1 million uniformly random samples from the designed libraries with the corresponding unrestricted model. Score distributions are reported as boxplots laid over violin plots for FW_kappa (blue) against each designed library (red). (C) Joint plot shows predicted enrichment of FW_kappa (red), equally weighted libraries (blue), ranibizumab weighted libraries (green), and BV weighted libraries (yellow) by the ranibizumab unrestricted model on the x-axis and the BV unrestricted model on the y-axis. The mean scores for FW_kappa are indicated by the dotted lines. Panels D–F show sequence logos (Schneider and Stephens 1990) for enriched nonspecific motifs in the ranibizumab weighted library over the BV weighted library discovered by STREME. (D) RRY motif (P-value = 4.8 × 10−2315). (E) VVT motif (P-value = 4.2 × 10−38). (F) WWH motif (P-value = 9.8 × 10⁻²¹).