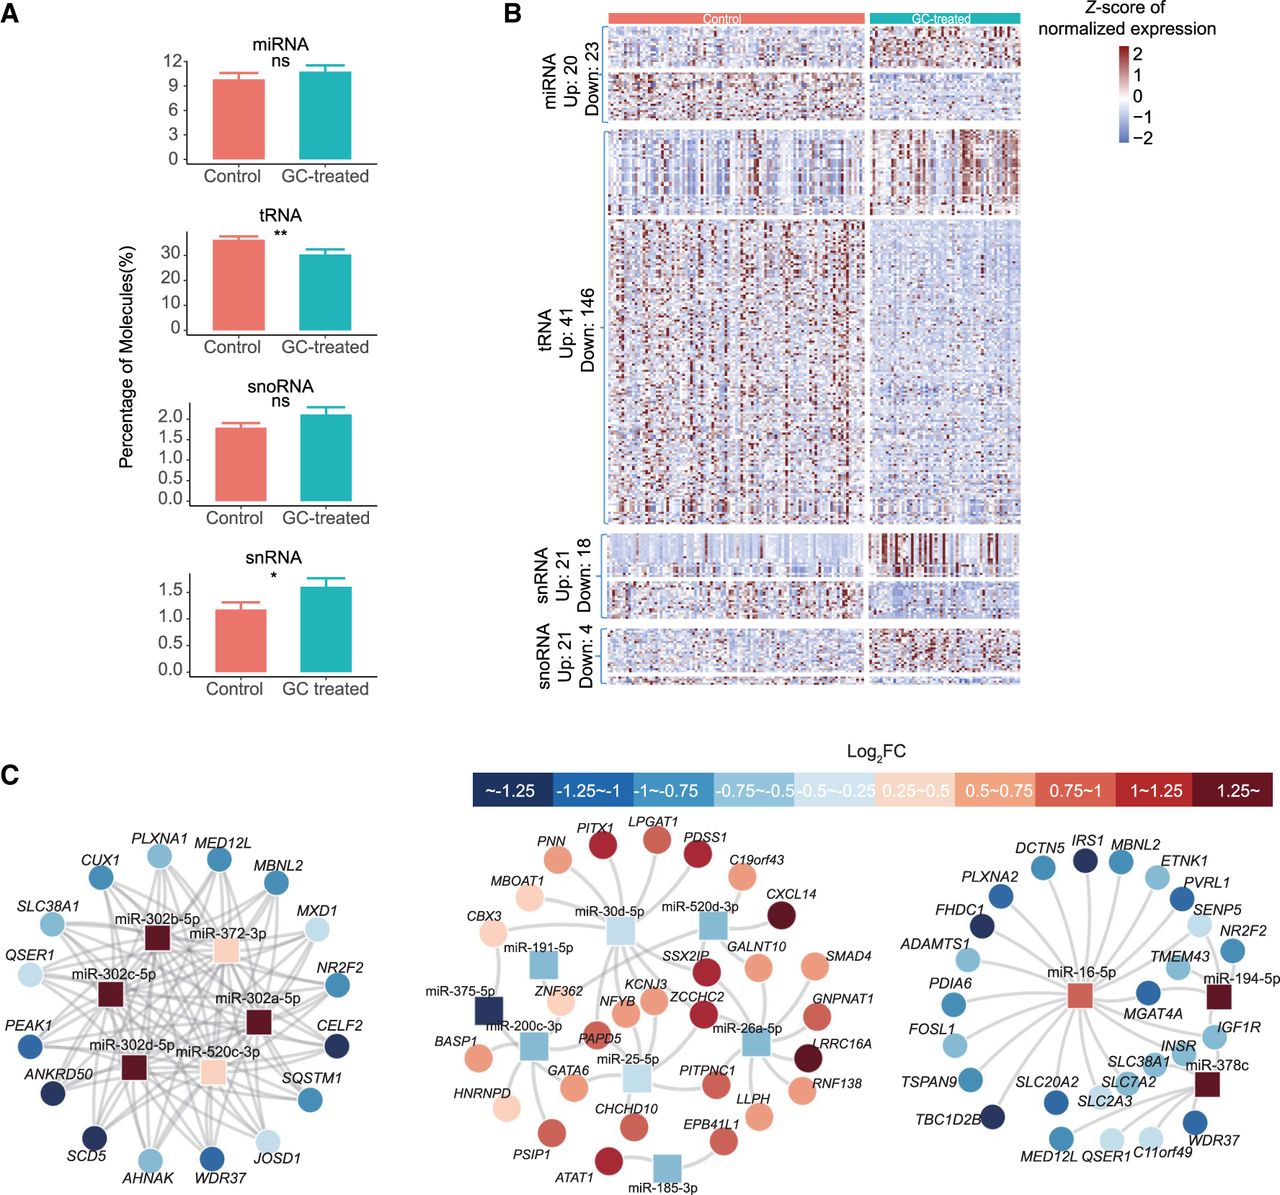
Figure 5.
Characterization of small RNAs in control and glucocorticoid-exposed embryos. (A) The proportion of miRNAs, tRNAs, snoRNAs, and snRNAs in control and treated embryos. (B) Heatmap depicting the significant differentially expressed small RNA between control and glucocorticoid-exposed embryos. The type and the number of differentially expressed small RNAs are shown on the left. (C) Node-link diagram for differentially expressed miRNA–mRNA coexpression regulatory network. Red and blue represent log2 fold changes of expression between control and treated cells.