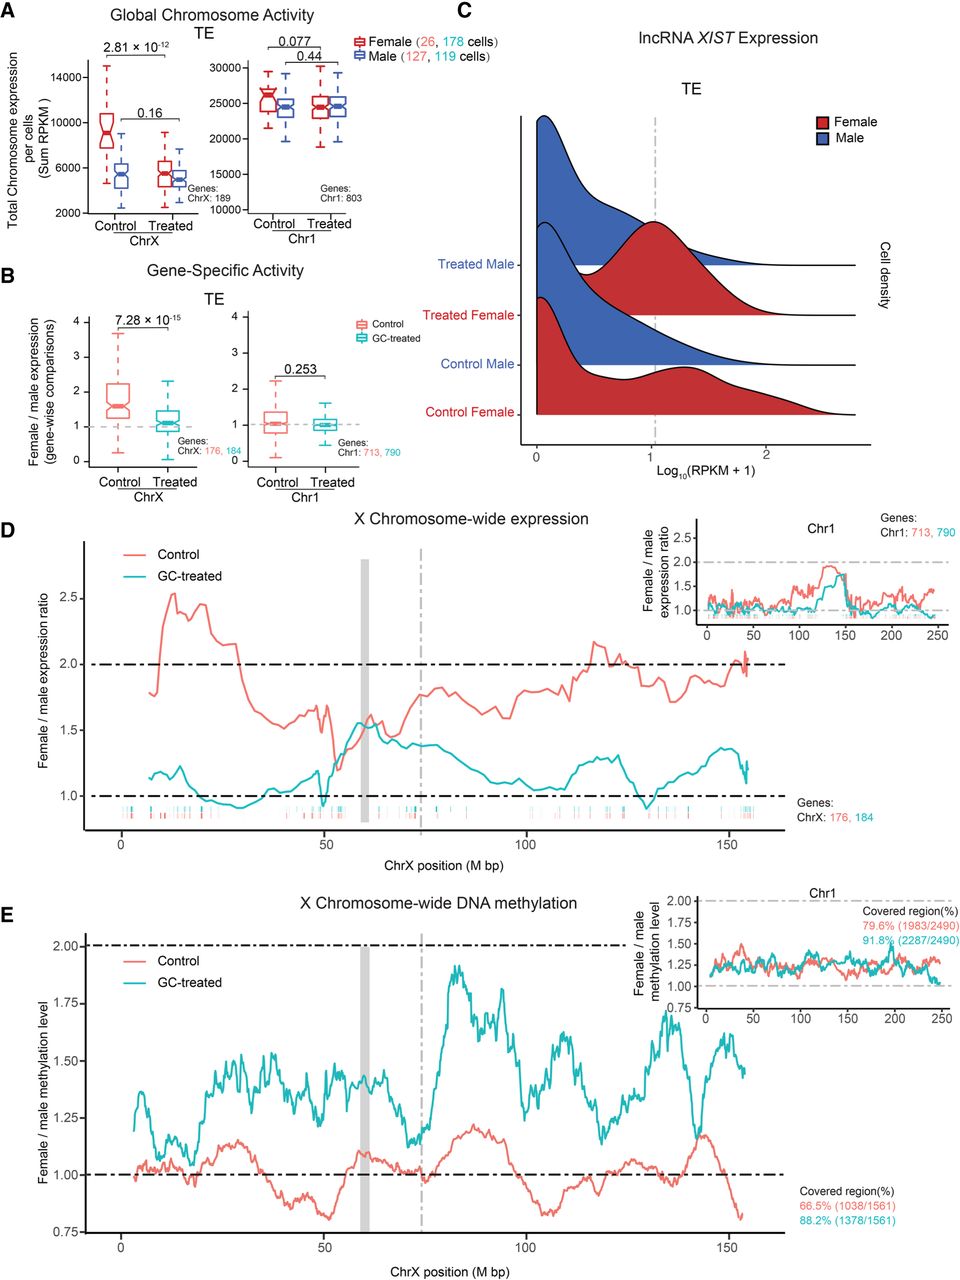
Glucocorticoid exposure perturbs X Chromosome dosage compensation. (A) Boxplots of X Chromosome and Chromosome 1 RPKM sums stratified by sex and treatment. Color represents sex. P-value was calculated using the two-sided Wilcoxon test. (B) Boxplots of female-to-male expression ratios of X Chromosome and Chromosome 1 linked genes in TE cells. Color represents treatment and control. P-value was calculated using the two-sided Wilcoxon test. (C) Ridge plot for XIST expression stratified by sex and treatment in TE cells. Color represents sex. (D) Sliding window (20-nearest genes) of female-to-male expression average along the X Chromosome for TE cells. The ticks below the moving-average lines indicate the location of expressed genes included in the estimates, colored according to different treatments. The gray block represents the locus of the centromere position. The gray dashed line denotes the locus of XIST. Similar analysis was performed for Chromosome 1. (E) Female-to-male moving methylation average along the X Chromosome in TE cells using a 50-nearest 100-kb sliding window. Chromosome 1 included for comparison. Colored according to different treatments. The gray block represents the locus of the centromere position. The gray dashed line denotes the locus of XIST.