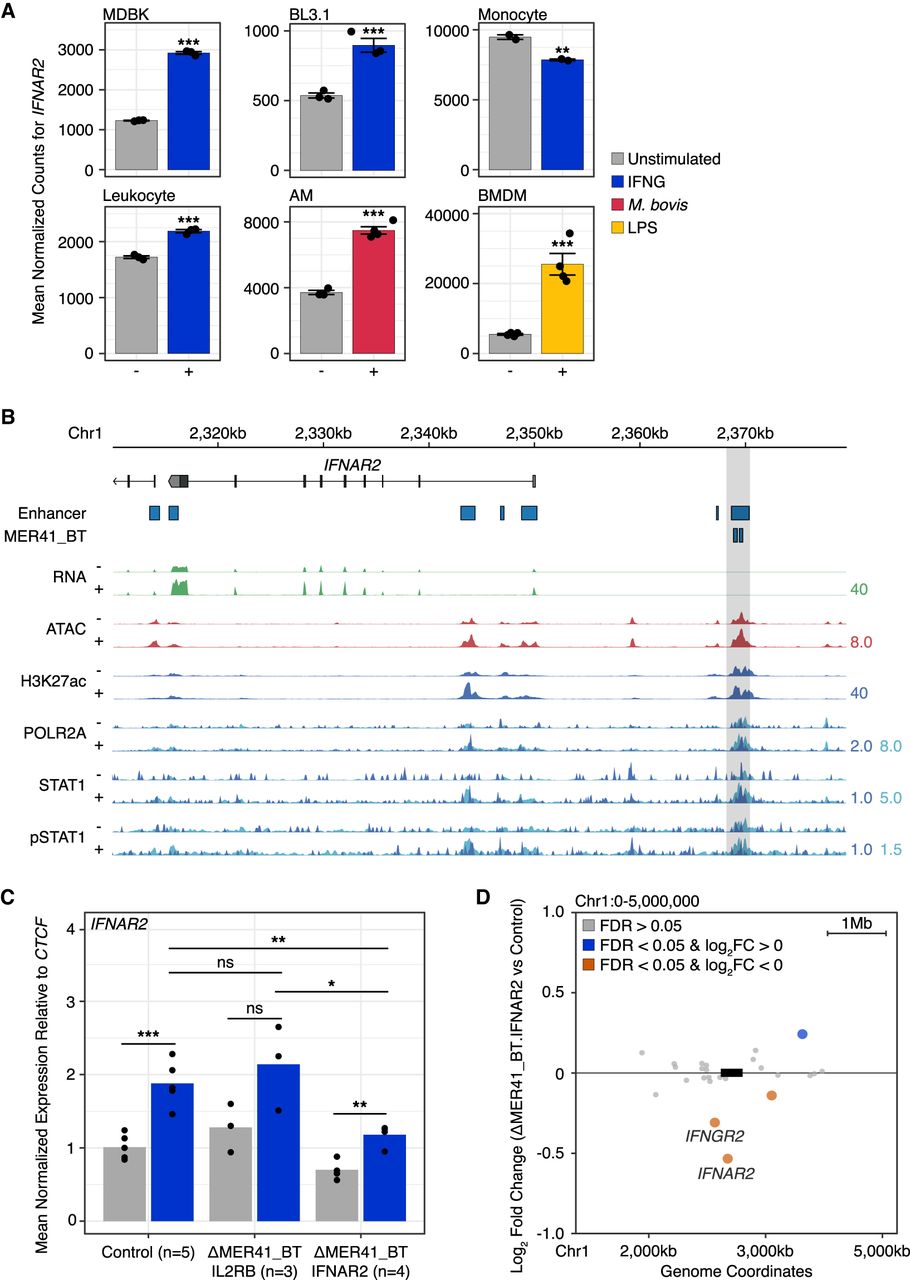
Co-option of a MER41_BT element for IFNAR2 regulation. (A) Mean DESeq2-normalized counts showing expression for IFNAR2 from wild-type bovine cells. (***) FDR < 0.0001, (**) FDR < 0.001. Error bars denote SEM. (B) Genome Browser view of IFNAR2. MDBK RNA-seq, ATAC-seq, and CUT&RUN tracks are normalized per million reads. CUT&RUN tracks for POLR2A, STAT1, and pSTAT1 pulldowns are divided by aligned fragments ≤150 bp (dark blue) and >150 bp (light blue). IFNG enhancers shown indicate predicted IFNG-inducible H3K27ac peaks. MER41_BT.IFNAR2 (Chr 1: 2,368,871–2,369,745) is highlighted in gray. Predicted IFNG-inducible enhancers are shown. Values on the right of each track correspond to signal maxima. (C) qPCR of IFNAR2 expression levels in control (n = 5), MER41_BT.IL2RB (n = 3), and MER41_BT.IFNAR2 (n = 4) MDBK clonal cells after IFNG treatment. Data points denote clonal replicates. (*) P < 0.05, (**) P < 0.001, (***) P < 0.0001, Student's t-test. (D) RNA-seq gene expression differences caused by the MER41_BT.IFNAR2 deletion within a 5-Mb window centered on the deletion site (box not to scale), after IFNG stimulation. Significantly up-regulated (blue) and down-regulated (orange) genes within 500 kb of the element are labeled.