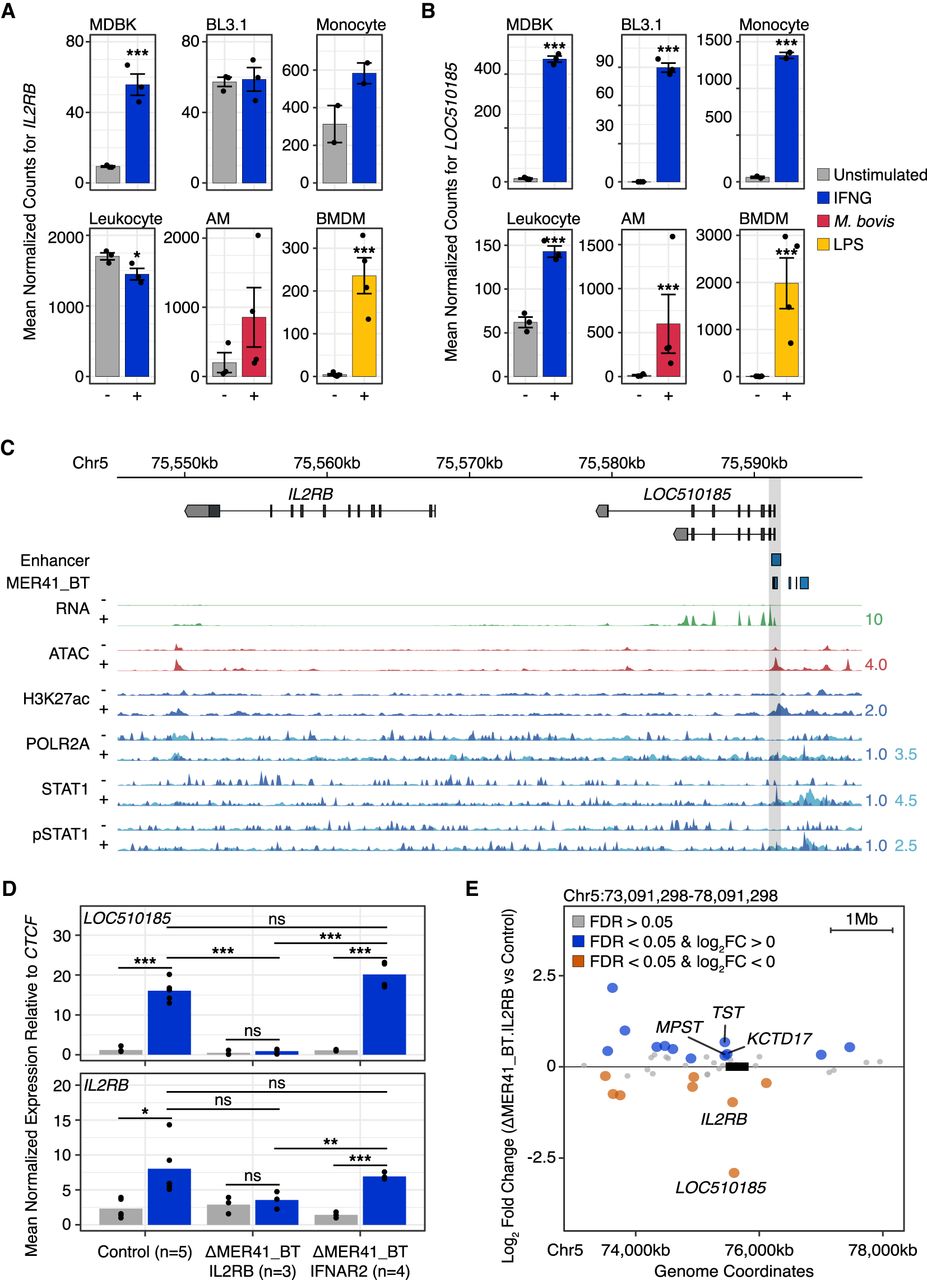
Co-option of a MER41_BT element for IL2RB and LOC510185 regulation. (A) DESeq2-normalized counts showing immune-stimulated expression for IL2RB from MDBK (n = 3), BL3.1 (n = 3), monocytes (n = 2), leukocytes (n = 3), alveolar macrophages (AM, n = 3 untreated, n = 4 stimulated), and bone marrow–derived macrophages (BMDM, n = 4). Treatments are indicated by color. (***) FDR < 0.0001, (*) FDR < 0.01. Error bars denote SEM. (B) Normalized counts as in A but for LOC510185. (C) Genome Browser view of IL2RB and LOC510185. MDBK RNA-seq, ATAC-seq, and CUT&RUN tracks are CPM-normalized. CUT&RUN signal profile tracks for POLR2A, STAT1, and pSTAT1 pulldowns were generated using subnucleosomal fragments ≤150 bp (dark blue) as well as larger fragments >150 bp (light blue). MER41_BT.IL2RB (Chr 5: 75,591,298–75,591,607) is highlighted in gray. Predicted IFNG-inducible enhancers are shown. Values on the right of each track correspond to signal maxima. (D) RT-qPCR of LOC510185 and IL2RB expression levels in control (n = 5), MER41_BT.IL2RB (n = 3), and MER41_BT.IFNAR2 (n = 4) MDBK clonal cells after IFNG treatment. Data points denote clonal replicates. (*) P < 0.05, (**) P < 0.001, (***) P < 0.0001, Student's t-test. (E) RNA-seq gene expression differences caused by the MER41_BT.IL2RB deletion within a 5-Mb window centered on the deletion site (box not to scale), after IFNG-stimulation. Significantly up-regulated (blue) and down-regulated (orange) genes within 500 kb of the element are labeled. (AM) Alveolar macrophage, (BMDM) bone marrow–derived macrophage.