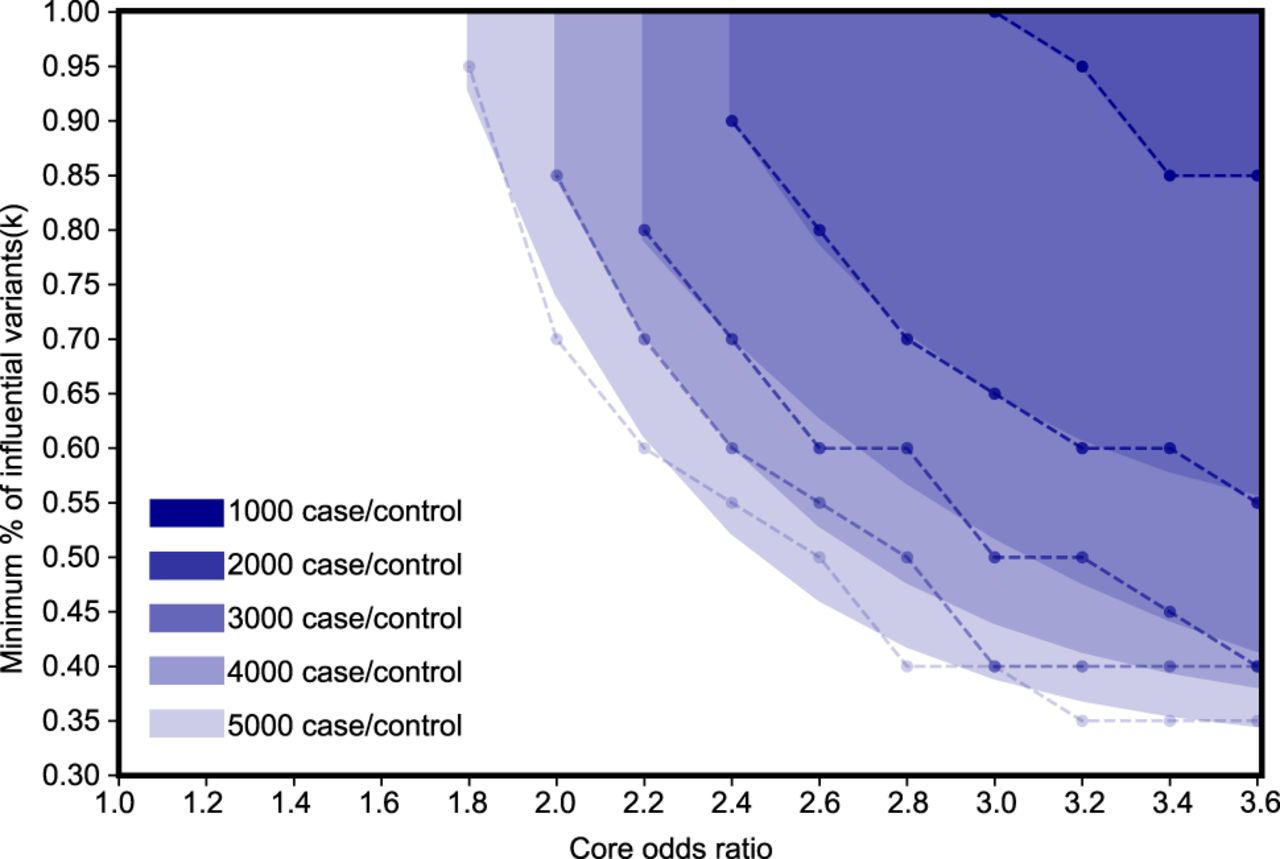
Figure 2.
The power assessment for POKEMON with different configurations and the structure kernel. Each dashed line represents the minimum percentages of influential variants and minimum core variant odds ratios required to reach the power of 0.8 when the number of cases/controls is fixed. The empirical power is calculated by the percentage of tests with a P-value below the significance level out of 500 replicates. The edge of each shade is the inferred power boundary fit with an exponential function.