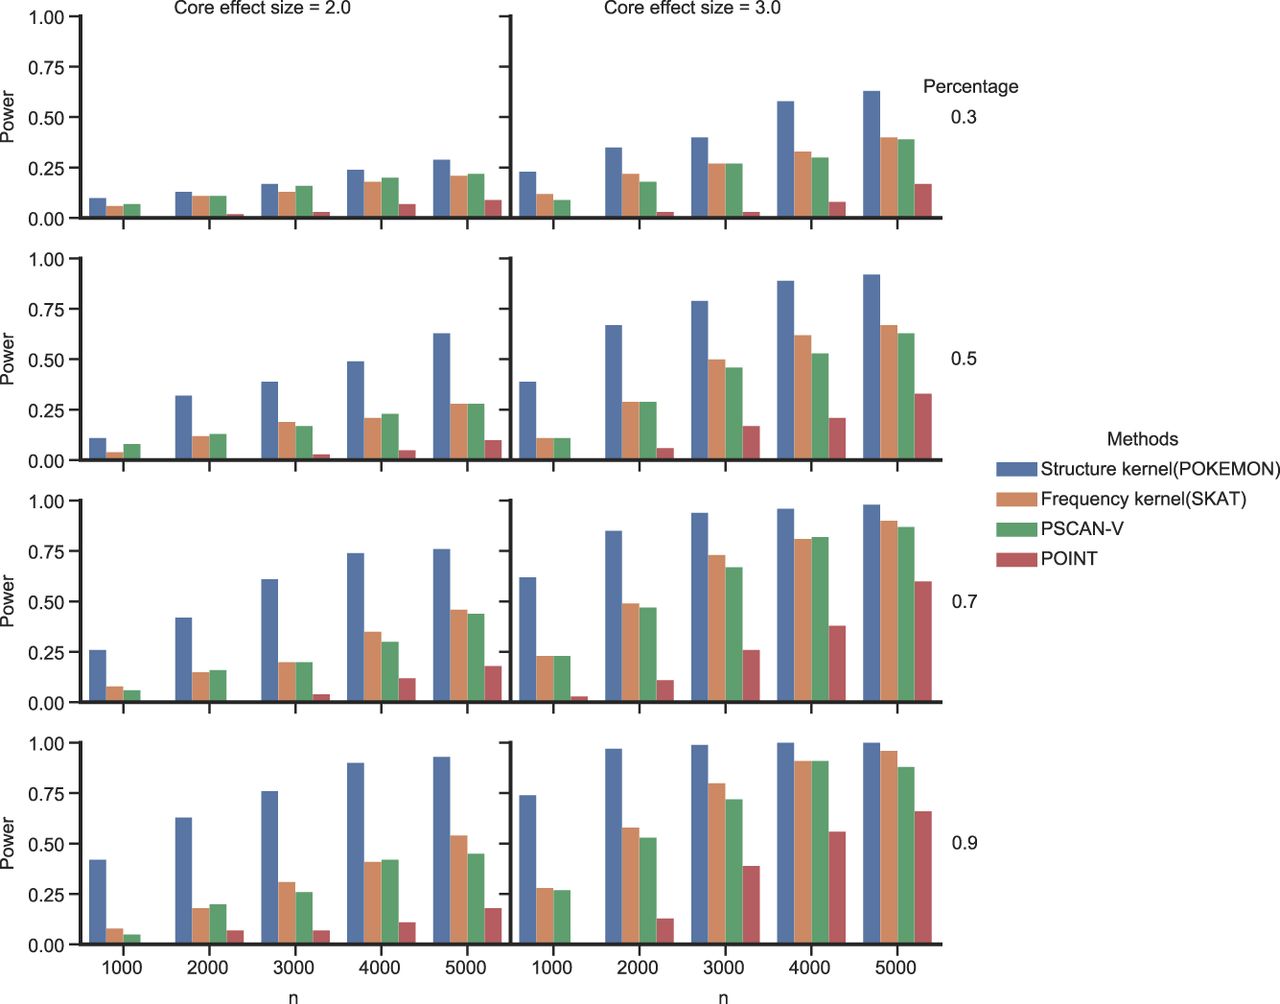
Figure 1.
The empirical power for detecting the association between the phenotype and a core pattern on the protein among structure kernel (POKEMON), frequency kernel (SKAT), PSCAN with variance (PSCAN-V), and POINT. The core variant odds ratio is 2.0 or 3.0 (left to right). The percentage of pathological variants within the selected 50 variants ranges from 0.3 to 0.9 (top to bottom). The simulated phenotype is calculated based on the core variant odds ratio and the percentage of pathological variants. The empirical power is calculated by the percentage of tests with a P-value below the significance level out of 100 replicates.